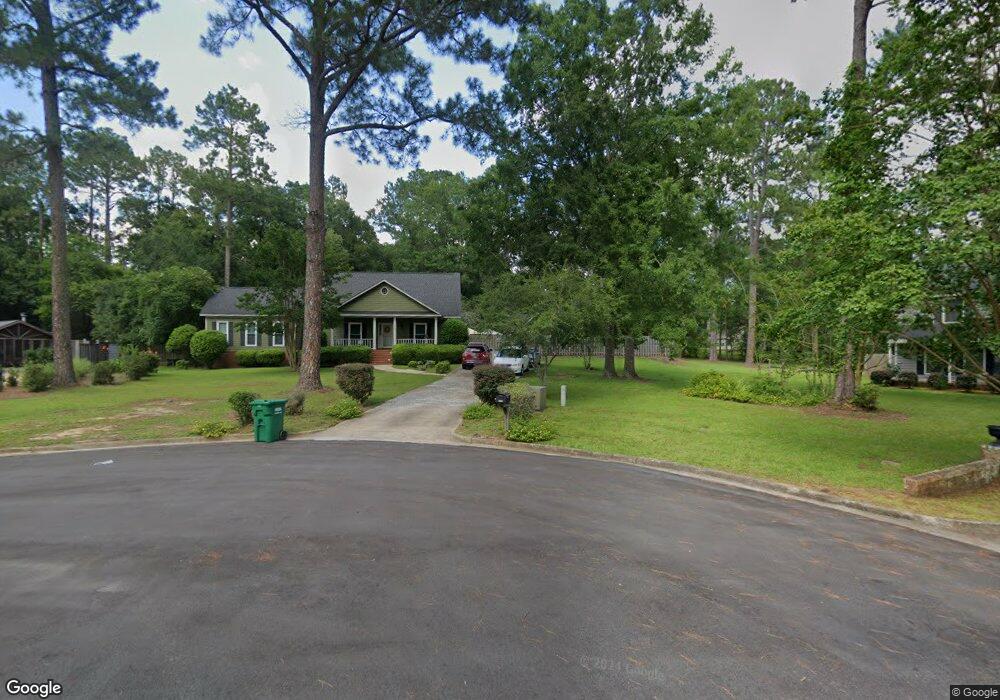
2507 Kinloch Ct Albany, GA 31721
Saint Andrews NeighborhoodEstimated Value: $276,000 - $312,000
4
Beds
4
Baths
2,818
Sq Ft
$105/Sq Ft
Est. Value
About This Home
This home is located at 2507 Kinloch Ct, Albany, GA 31721 and is currently estimated at $295,119, approximately $104 per square foot. 2507 Kinloch Ct is a home located in Dougherty County with nearby schools including Live Oak Elementary School, Merry Acres Middle School, and Westover High School.
Ownership History
Date
Name
Owned For
Owner Type
Purchase Details
Closed on
Jan 22, 2018
Sold by
Lark Jeffrey Wayne
Bought by
Lark Juana Coronado
Current Estimated Value
Purchase Details
Closed on
Nov 6, 2007
Sold by
Kelly Jane S
Bought by
Lark Juana Coronado and Lark Jeffrey Wayne
Home Financials for this Owner
Home Financials are based on the most recent Mortgage that was taken out on this home.
Original Mortgage
$256,540
Interest Rate
6.32%
Mortgage Type
New Conventional
Purchase Details
Closed on
Sep 27, 1999
Sold by
Whitaker James W and Whitaker Lisa C
Bought by
Kelly Jane S
Purchase Details
Closed on
Mar 31, 1994
Sold by
Aultman Zackery
Bought by
Whitaker James W and Whitaker Lisa C
Purchase Details
Closed on
Nov 16, 1992
Sold by
Aultman Brenda R
Bought by
Aultman Zackery
Purchase Details
Closed on
Mar 7, 1985
Sold by
Watson Gregory and Watson Jan
Bought by
Aultman Zackery and Aultman B
Create a Home Valuation Report for This Property
The Home Valuation Report is an in-depth analysis detailing your home's value as well as a comparison with similar homes in the area
Home Values in the Area
Average Home Value in this Area
Purchase History
| Date | Buyer | Sale Price | Title Company |
|---|---|---|---|
| Lark Juana Coronado | -- | -- | |
| Lark Juana Coronado | $254,000 | -- | |
| Kelly Jane S | $162,200 | -- | |
| Whitaker James W | $122,500 | -- | |
| Aultman Zackery | -- | -- | |
| Aultman Zackery | -- | -- |
Source: Public Records
Mortgage History
| Date | Status | Borrower | Loan Amount |
|---|---|---|---|
| Previous Owner | Lark Juana Coronado | $256,540 |
Source: Public Records
Tax History Compared to Growth
Tax History
| Year | Tax Paid | Tax Assessment Tax Assessment Total Assessment is a certain percentage of the fair market value that is determined by local assessors to be the total taxable value of land and additions on the property. | Land | Improvement |
|---|---|---|---|---|
| 2024 | $3,101 | $67,005 | $5,920 | $61,085 |
| 2023 | $2,190 | $67,005 | $5,920 | $61,085 |
| 2022 | $3,040 | $67,005 | $5,920 | $61,085 |
| 2021 | $2,818 | $67,005 | $5,920 | $61,085 |
| 2020 | $2,825 | $67,005 | $5,920 | $61,085 |
| 2019 | $2,781 | $65,765 | $5,920 | $59,845 |
| 2018 | $2,793 | $65,765 | $5,920 | $59,845 |
| 2017 | $2,602 | $65,765 | $5,920 | $59,845 |
| 2016 | $2,603 | $65,765 | $5,920 | $59,845 |
| 2015 | $2,611 | $65,765 | $5,920 | $59,845 |
| 2014 | $2,727 | $69,440 | $9,600 | $59,840 |
Source: Public Records
Map
Nearby Homes
- 2504 W Alberson Dr
- 2600 E Doublegate Dr
- 2509 E Alberson Dr
- 2532 E Alberson Dr
- 2423 E Alberson Dr
- 2514 E Doublegate Dr
- 2530 E Alberson Dr
- 2421 E Alberson Dr
- 2720 Somerset Dr
- 3424 Bellingham Ln
- 2305 E Alberson Dr
- 2707 Somerset Dr
- 2823 W Doublegate Dr
- 2713 Westmeade Rd
- 2303 Saddlebrook Ct
- 3422 Plantation Dr
- 2600 Shannon Rd
- 3812 Old Dawson Rd
- 2207 Vineyard Ct
- 2829 N Doublegate Dr
- 2504 Kinloch Ct
- 2505 Kinloch Ct
- 2529 Brookhaven Ct
- 2502 Kinloch Ct
- 2503 Kinloch Ct
- 2523 Brookhaven Ct
- 2531 Brookhaven Ct
- 2521 Brookhaven Ct
- 2510 W Alberson Dr
- 3600 Old Dawson Rd
- 2512 W Alberson Dr
- 2514 W Alberson Dr
- 3516 Old Dawson Rd
- 2508 W Alberson Dr
- 2519 Brookhaven Ct
- 2516 W Alberson Dr
- 2528 Brookhaven Ct
- 2526 Brookhaven Ct
- 2532 Brookhaven Ct
- 2530 Brookhaven Ct