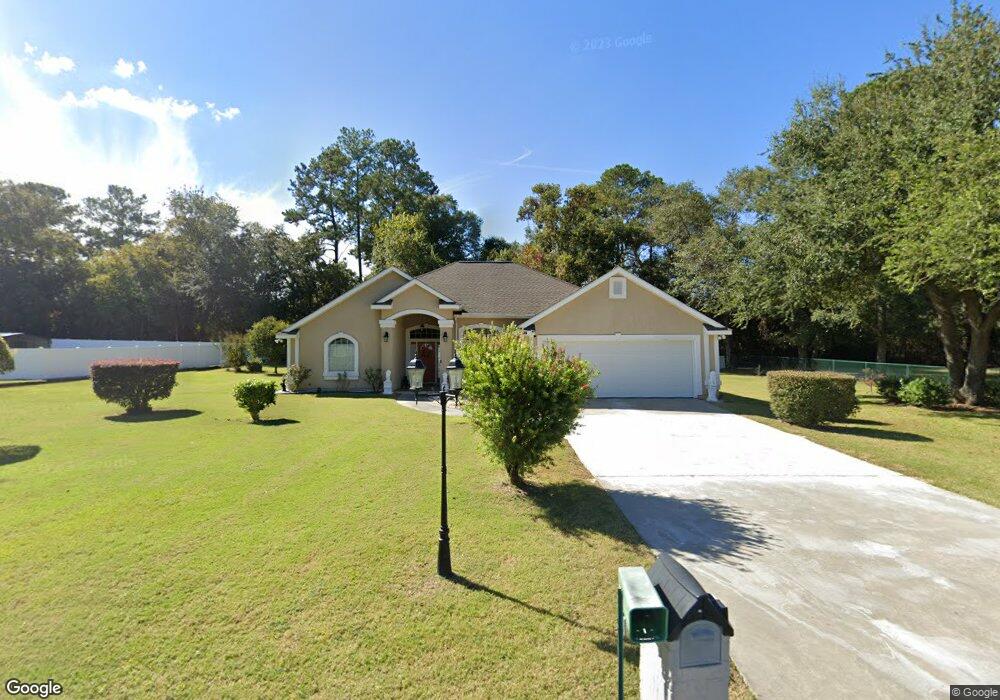
2507 Lejuene Rd Waycross, GA 31501
Estimated Value: $277,000 - $291,000
3
Beds
2
Baths
2,029
Sq Ft
$140/Sq Ft
Est. Value
About This Home
This home is located at 2507 Lejuene Rd, Waycross, GA 31501 and is currently estimated at $284,108, approximately $140 per square foot. 2507 Lejuene Rd is a home located in Ware County with nearby schools including Wacona Elementary School, Ware County Middle School, and Ware County High School.
Ownership History
Date
Name
Owned For
Owner Type
Purchase Details
Closed on
Jan 16, 2018
Sold by
Sinclair Raymond O
Bought by
Sinclair Raymond O and Sinclair Jasmine N
Current Estimated Value
Purchase Details
Closed on
Sep 9, 2005
Sold by
Cayman Builders Inc
Bought by
Sinclair Raymond O and Sinclair Verna A
Home Financials for this Owner
Home Financials are based on the most recent Mortgage that was taken out on this home.
Original Mortgage
$169,600
Interest Rate
5.86%
Mortgage Type
New Conventional
Create a Home Valuation Report for This Property
The Home Valuation Report is an in-depth analysis detailing your home's value as well as a comparison with similar homes in the area
Home Values in the Area
Average Home Value in this Area
Purchase History
| Date | Buyer | Sale Price | Title Company |
|---|---|---|---|
| Sinclair Raymond O | -- | -- | |
| Sinclair Raymond O | $20,000 | -- |
Source: Public Records
Mortgage History
| Date | Status | Borrower | Loan Amount |
|---|---|---|---|
| Previous Owner | Sinclair Raymond O | $169,600 |
Source: Public Records
Tax History Compared to Growth
Tax History
| Year | Tax Paid | Tax Assessment Tax Assessment Total Assessment is a certain percentage of the fair market value that is determined by local assessors to be the total taxable value of land and additions on the property. | Land | Improvement |
|---|---|---|---|---|
| 2024 | $1,585 | $101,946 | $8,260 | $93,686 |
| 2023 | $1,617 | $90,449 | $9,252 | $81,197 |
| 2022 | $1,788 | $90,173 | $9,252 | $80,921 |
| 2021 | $1,892 | $71,422 | $9,252 | $62,170 |
| 2020 | $1,912 | $69,278 | $9,252 | $60,026 |
| 2019 | $1,950 | $69,278 | $9,252 | $60,026 |
| 2018 | $1,968 | $67,135 | $9,252 | $57,883 |
| 2017 | $1,966 | $67,135 | $9,252 | $57,883 |
| 2016 | $1,966 | $67,135 | $9,252 | $57,883 |
| 2015 | $1,647 | $52,128 | $9,252 | $42,876 |
| 2014 | $1,642 | $52,128 | $9,252 | $42,876 |
| 2013 | -- | $52,128 | $9,252 | $42,876 |
Source: Public Records
Map
Nearby Homes