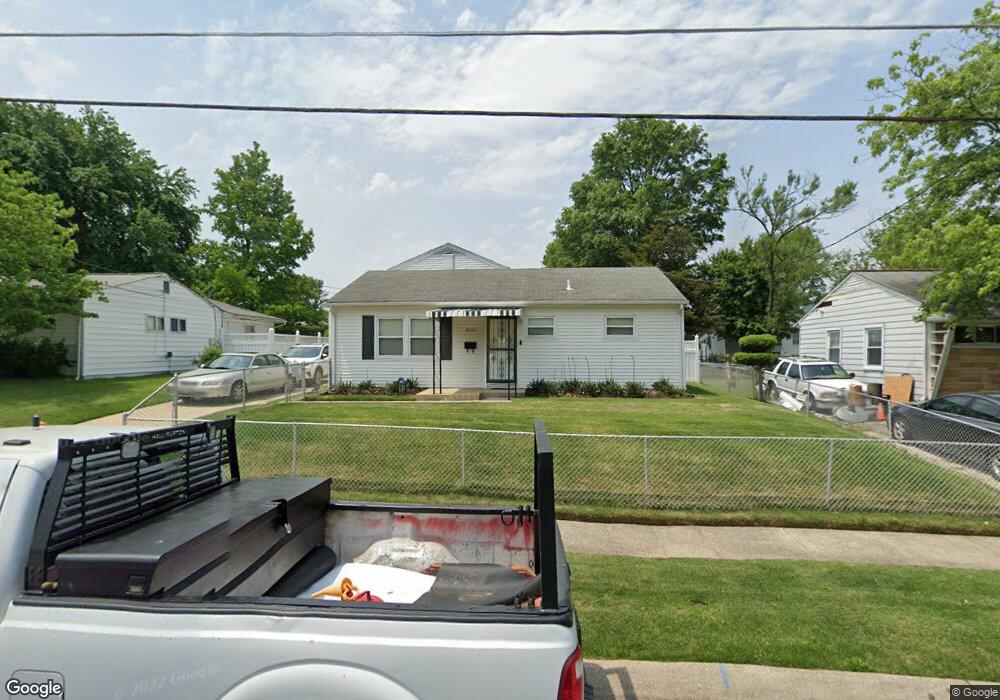
2507 Newglen Ave District Heights, MD 20747
Estimated Value: $326,397 - $396,000
--
Bed
2
Baths
1,504
Sq Ft
$236/Sq Ft
Est. Value
About This Home
This home is located at 2507 Newglen Ave, District Heights, MD 20747 and is currently estimated at $354,599, approximately $235 per square foot. 2507 Newglen Ave is a home located in Prince George's County with nearby schools including North Forestville Elementary School, Walker Mill Middle School, and Dr. Henry A. Wise Jr. High School.
Ownership History
Date
Name
Owned For
Owner Type
Purchase Details
Closed on
Feb 4, 2000
Sold by
Secretary Of H U D
Bought by
Henighan and Bracey Sheila E
Current Estimated Value
Purchase Details
Closed on
Nov 21, 1997
Sold by
Barnes Dondi E
Bought by
Secretary Of H U D and Union Center Plaza Phase Ii
Purchase Details
Closed on
Apr 19, 1994
Sold by
Equity Venture Inc
Bought by
Barnes Dondi E
Home Financials for this Owner
Home Financials are based on the most recent Mortgage that was taken out on this home.
Original Mortgage
$109,386
Interest Rate
7.45%
Purchase Details
Closed on
Mar 25, 1994
Sold by
Secretary Of H U D
Bought by
Equity Venture Inc
Home Financials for this Owner
Home Financials are based on the most recent Mortgage that was taken out on this home.
Original Mortgage
$109,386
Interest Rate
7.45%
Purchase Details
Closed on
Sep 30, 1993
Sold by
Adams
Bought by
Sec Hud
Create a Home Valuation Report for This Property
The Home Valuation Report is an in-depth analysis detailing your home's value as well as a comparison with similar homes in the area
Home Values in the Area
Average Home Value in this Area
Purchase History
| Date | Buyer | Sale Price | Title Company |
|---|---|---|---|
| Henighan | $115,000 | -- | |
| Secretary Of H U D | $126,620 | -- | |
| Barnes Dondi E | $109,500 | -- | |
| Equity Venture Inc | $82,400 | -- | |
| Sec Hud | $102,900 | -- |
Source: Public Records
Mortgage History
| Date | Status | Borrower | Loan Amount |
|---|---|---|---|
| Previous Owner | Sec Hud | $109,386 |
Source: Public Records
Tax History Compared to Growth
Tax History
| Year | Tax Paid | Tax Assessment Tax Assessment Total Assessment is a certain percentage of the fair market value that is determined by local assessors to be the total taxable value of land and additions on the property. | Land | Improvement |
|---|---|---|---|---|
| 2025 | $3,576 | $308,700 | -- | -- |
| 2024 | $3,576 | $286,200 | $0 | $0 |
| 2023 | $3,414 | $263,700 | $60,300 | $203,400 |
| 2022 | $3,306 | $258,533 | $0 | $0 |
| 2021 | $3,202 | $253,367 | $0 | $0 |
| 2020 | $3,161 | $248,200 | $60,100 | $188,100 |
| 2019 | $3,039 | $229,367 | $0 | $0 |
| 2018 | $2,903 | $210,533 | $0 | $0 |
| 2017 | $2,783 | $191,700 | $0 | $0 |
| 2016 | -- | $178,900 | $0 | $0 |
| 2015 | $2,658 | $166,100 | $0 | $0 |
| 2014 | $2,658 | $153,300 | $0 | $0 |
Source: Public Records
Map
Nearby Homes
- 2501 Ritchie Rd
- 2605 Millvale Ave
- 2613 Millvale Ave
- 7304 Malden Ln
- 2313 Wintergreen Ave
- 2614 Boones Ln
- 2706 Kirtland Ave
- 2215 Oak Glen Way
- 2114 Glendora Dr
- 7813 Jordan Park Blvd
- 7515 Martha St
- 2700 Phelps Ave
- 7804 Darcy Rd
- 2811 Lakehurst Ave
- 7118 Foster St
- 1804 Brewton Ct
- 2716 Timbercrest Dr
- 6918 Gateway Blvd
- 2722 Timbercrest Dr
- 3113 Lakehurst Ave
- 2505 Newglen Ave
- 2509 Newglen Ave
- 2512 Millvale Ave
- 2514 Millvale Ave
- 2510 Millvale Ave
- 2511 Newglen Ave
- 2503 Newglen Ave
- 2506 Newglen Ave
- 2516 Millvale Ave
- 2508 Newglen Ave
- 2504 Newglen Ave
- 2508 Millvale Ave
- 2513 Newglen Ave
- 2502 Newglen Ave
- 2510 Newglen Ave
- 2518 Millvale Ave
- 2501 Newglen Ave
- 2512 Newglen Ave
- 2515 Newglen Ave
- 2504 Millvale Ave