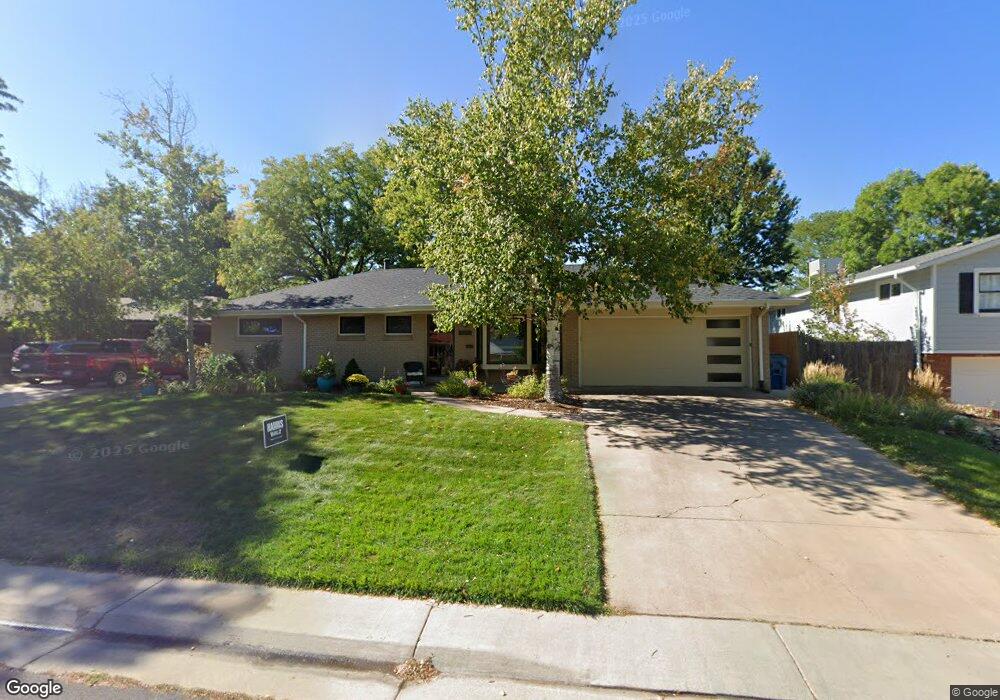
2507 S Krameria St Denver, CO 80222
Holly Hills NeighborhoodEstimated Value: $696,497 - $812,000
4
Beds
3
Baths
1,857
Sq Ft
$418/Sq Ft
Est. Value
About This Home
This home is located at 2507 S Krameria St, Denver, CO 80222 and is currently estimated at $776,374, approximately $418 per square foot. 2507 S Krameria St is a home located in Arapahoe County with nearby schools including Holly Hills Elementary School, West Middle School, and Cherry Creek High School.
Ownership History
Date
Name
Owned For
Owner Type
Purchase Details
Closed on
Oct 6, 2021
Sold by
Coulter Bruce E and Spector Teri L
Bought by
Coulter-Spector Trust and Coulter
Current Estimated Value
Purchase Details
Closed on
Jul 25, 1995
Sold by
Lentini Elizabeth J and Gibson Kevin W
Bought by
Coulter Bruce E and Spector Teri L
Home Financials for this Owner
Home Financials are based on the most recent Mortgage that was taken out on this home.
Original Mortgage
$155,600
Interest Rate
7.25%
Purchase Details
Closed on
Nov 9, 1992
Sold by
Hall Elizabeth A Hall James R
Bought by
Lentini Elizabeth J and Gibson Kevin W
Purchase Details
Closed on
Mar 17, 1989
Sold by
Conversion Arapco
Bought by
Hall Elizabeth A Hall James R
Purchase Details
Closed on
Aug 1, 1980
Sold by
Conversion Arapco
Bought by
Conversion Arapco
Purchase Details
Closed on
Jul 4, 1776
Bought by
Conversion Arapco
Create a Home Valuation Report for This Property
The Home Valuation Report is an in-depth analysis detailing your home's value as well as a comparison with similar homes in the area
Home Values in the Area
Average Home Value in this Area
Purchase History
| Date | Buyer | Sale Price | Title Company |
|---|---|---|---|
| Coulter-Spector Trust | -- | None Listed On Document | |
| Coulter Bruce E | $194,500 | Land Title | |
| Lentini Elizabeth J | -- | -- | |
| Hall Elizabeth A Hall James R | -- | -- | |
| Conversion Arapco | -- | -- | |
| Conversion Arapco | -- | -- |
Source: Public Records
Mortgage History
| Date | Status | Borrower | Loan Amount |
|---|---|---|---|
| Previous Owner | Coulter Bruce E | $155,600 |
Source: Public Records
Tax History Compared to Growth
Tax History
| Year | Tax Paid | Tax Assessment Tax Assessment Total Assessment is a certain percentage of the fair market value that is determined by local assessors to be the total taxable value of land and additions on the property. | Land | Improvement |
|---|---|---|---|---|
| 2024 | $3,278 | $44,080 | -- | -- |
| 2023 | $3,278 | $44,080 | $0 | $0 |
| 2022 | $2,794 | $37,134 | $0 | $0 |
| 2021 | $2,810 | $37,134 | $0 | $0 |
| 2020 | $3,306 | $36,358 | $0 | $0 |
| 2019 | $3,209 | $36,358 | $0 | $0 |
| 2018 | $2,926 | $31,226 | $0 | $0 |
| 2017 | $2,890 | $31,226 | $0 | $0 |
| 2016 | $2,577 | $26,308 | $0 | $0 |
| 2015 | $2,477 | $26,308 | $0 | $0 |
| 2014 | $2,109 | $20,441 | $0 | $0 |
| 2013 | -- | $22,200 | $0 | $0 |
Source: Public Records
Map
Nearby Homes
- 2325 S Linden Ct Unit B206
- 2375 S Linden Ct Unit A118
- 2375 S Linden Ct Unit A313
- 2375 S Linden Ct Unit A310
- 2375 S Linden Ct Unit A311
- 2300 S Krameria St
- 2696 S Jersey St
- 6102 E Yale Ave
- 6525 E Harvard Ave
- 5995 E Iliff Ave Unit 308
- 5770 E Warren Ave Unit 213
- 5875 E Iliff Ave Unit 108
- 5875 E Iliff Ave Unit D121
- 5770 E Warren Ave Unit 206
- 2525 S Ivanhoe Place
- 2332 S Leyden St
- 2225 S Jasmine St Unit 102
- 2225 S Jasmine St Unit 207
- 2781 S Kearney St
- 2700 S Holly St Unit 206
- 2513 S Krameria St
- 2506 S Kearney St
- 2500 S Kearney St
- 2512 S Kearney St
- 2519 S Krameria St
- 2506 S Krameria St
- 2490 S Jersey St
- 2495 S Krameria St
- 2518 S Kearney St
- 2524 S Krameria St
- 2496 S Kearney St
- 2553 S Krameria St
- 2473 S Krameria St
- 2544 S Krameria St
- 2496 S Krameria St
- 2524 S Kearney St
- 2450 S Jersey St
- 2488 S Kearney St
- 2507 S Kearney St
- 2501 S Kearney St