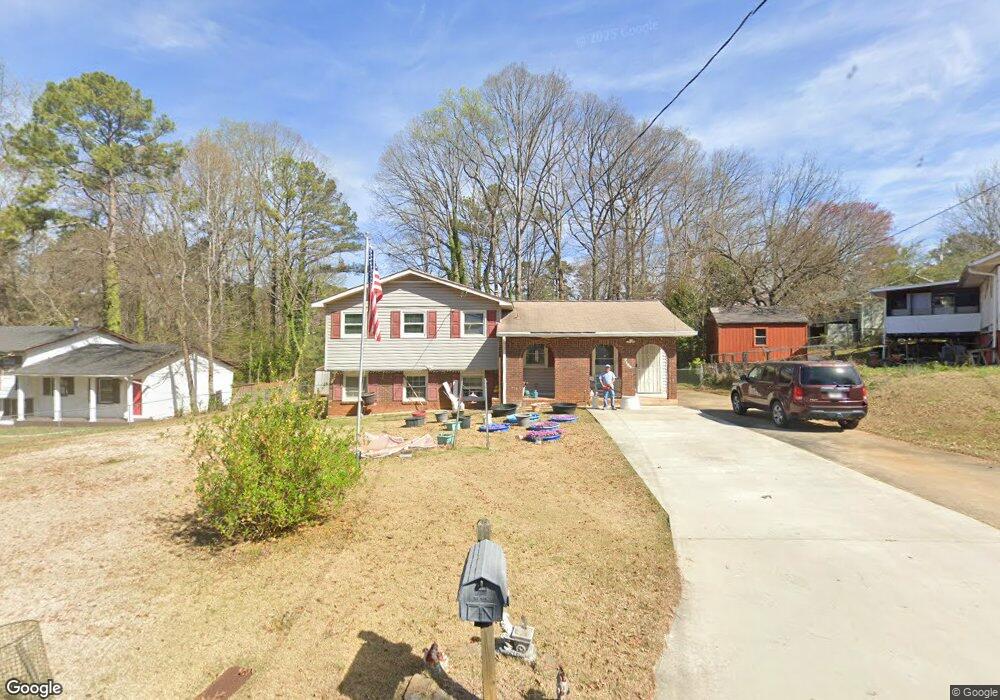
2508 Celina Ct Morrow, GA 30260
Estimated Value: $199,257 - $219,000
3
Beds
1
Bath
1,746
Sq Ft
$120/Sq Ft
Est. Value
About This Home
This home is located at 2508 Celina Ct, Morrow, GA 30260 and is currently estimated at $208,814, approximately $119 per square foot. 2508 Celina Ct is a home located in Clayton County with nearby schools including William M. Mcgarrah Elementary School, Morrow Middle School, and Morrow High School.
Ownership History
Date
Name
Owned For
Owner Type
Purchase Details
Closed on
Aug 30, 2018
Sold by
Tran Dinh V
Bought by
Tran Trang Hoang and Tran Dinh V
Current Estimated Value
Purchase Details
Closed on
Jan 30, 2018
Sold by
Tran Thong
Bought by
Tran Dinh V and Ton Hoa
Purchase Details
Closed on
Jan 6, 2009
Sold by
Midfirst Bank
Bought by
Hud-Housing Of Urban Dev
Purchase Details
Closed on
Jun 30, 2000
Sold by
Johnson Travis E and Johnson Terri L
Bought by
Parks Janis R
Home Financials for this Owner
Home Financials are based on the most recent Mortgage that was taken out on this home.
Original Mortgage
$91,207
Interest Rate
8.17%
Mortgage Type
New Conventional
Purchase Details
Closed on
Feb 20, 1995
Sold by
Wrye Randall H Elizabet
Bought by
Johnson Travis E Terri L
Home Financials for this Owner
Home Financials are based on the most recent Mortgage that was taken out on this home.
Original Mortgage
$75,378
Interest Rate
8.5%
Mortgage Type
VA
Create a Home Valuation Report for This Property
The Home Valuation Report is an in-depth analysis detailing your home's value as well as a comparison with similar homes in the area
Home Values in the Area
Average Home Value in this Area
Purchase History
| Date | Buyer | Sale Price | Title Company |
|---|---|---|---|
| Tran Trang Hoang | -- | -- | |
| Tran Dinh V | -- | -- | |
| Hud-Housing Of Urban Dev | -- | -- | |
| Midfirst Bank | $83,541 | -- | |
| Parks Janis R | $92,000 | -- | |
| Johnson Travis E Terri L | $73,900 | -- |
Source: Public Records
Mortgage History
| Date | Status | Borrower | Loan Amount |
|---|---|---|---|
| Previous Owner | Parks Janis R | $91,207 | |
| Previous Owner | Johnson Travis E Terri L | $75,378 |
Source: Public Records
Tax History Compared to Growth
Tax History
| Year | Tax Paid | Tax Assessment Tax Assessment Total Assessment is a certain percentage of the fair market value that is determined by local assessors to be the total taxable value of land and additions on the property. | Land | Improvement |
|---|---|---|---|---|
| 2024 | $2,163 | $65,440 | $8,000 | $57,440 |
| 2023 | $2,071 | $67,480 | $8,000 | $59,480 |
| 2022 | $0 | $57,600 | $8,000 | $49,600 |
| 2021 | $1,264 | $42,000 | $8,000 | $34,000 |
| 2020 | $1,104 | $37,600 | $8,000 | $29,600 |
| 2019 | $958 | $33,600 | $6,400 | $27,200 |
| 2018 | $594 | $24,640 | $6,400 | $18,240 |
| 2017 | $596 | $24,640 | $6,400 | $18,240 |
| 2016 | $596 | $27,299 | $6,400 | $20,899 |
| 2015 | $431 | $0 | $0 | $0 |
| 2014 | $385 | $19,660 | $6,400 | $13,260 |
Source: Public Records
Map
Nearby Homes
- 2455 Lake Harbin Rd
- 2609 Lake Harbin Rd
- 6418 Maddox Rd
- 2649 Lake Harbin Rd
- 2577 Castile Dr
- 6205 Fieldcrest Dr
- 6155 Landover Cir Unit 2
- 6181 Castlewood Dr
- 2436 Wood Valley Dr
- 6397 E Meyer Dr
- 2718 Somerton Dr
- 2617 Terrace Pkwy
- 6584 Sleepy Hollow Ln
- 2613 Stratford Ln Unit 3
- 2306 Santa fe St Unit 9
- 2278 Santa fe St Unit 18
- 2280 Santa fe St Unit 17
- 6188 Cinnamon Ct
- 6046 Danbury Ct
- 6010 Fieldcrest Dr
- 2500 Celina Ct
- 6355 Veracruse Dr
- 0 Celina Ct Unit 8079181
- 6347 Veracruse Dr Unit 9
- 6347 Veracruse Dr
- 2503 Bonita Ct
- 2509 Bonita Ct
- 2496 Celina Ct
- 2507 Celina Ct
- 6371 Veracruse Dr
- 6337 Veracruse Dr
- 2499 Bonita Ct
- 2501 Celina Ct
- 0 Bonita Ct Unit 7141789
- 2497 Celina Ct
- 6381 Veracruse Dr
- 6354 Veracruse Dr
- 6362 Veracruse Dr
- 6346 Veracruse Dr
- 6370 Veracruse Dr