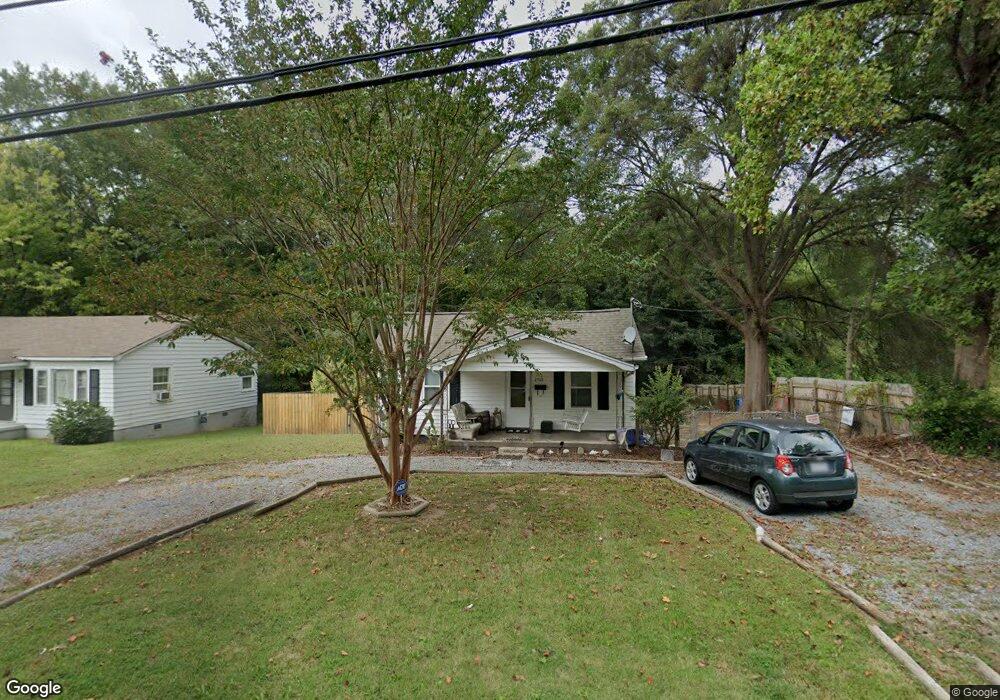
2508 Crescent Ln Gastonia, NC 28052
Estimated Value: $149,673 - $173,000
2
Beds
1
Bath
708
Sq Ft
$229/Sq Ft
Est. Value
About This Home
This home is located at 2508 Crescent Ln, Gastonia, NC 28052 and is currently estimated at $161,918, approximately $228 per square foot. 2508 Crescent Ln is a home located in Gaston County with nearby schools including Edward D. Sadler, Jr. Elementary School, Bessemer City Middle School, and Bessemer City High School.
Ownership History
Date
Name
Owned For
Owner Type
Purchase Details
Closed on
Apr 26, 2024
Sold by
Elders Lisa Howard and Tallent Robbie Dale
Bought by
Elders Lisa Howard and Tallent Robbie Dale
Current Estimated Value
Purchase Details
Closed on
Aug 30, 2021
Sold by
Elders Lisa Howard and Elders Lisa
Bought by
Elders Lisa Howard and Tallent Robbie Dale
Purchase Details
Closed on
Feb 14, 2008
Sold by
Bank Of New York
Bought by
Elders Lisa H
Purchase Details
Closed on
Sep 6, 2007
Sold by
Funderburke Robert L and Funderburke Frances E
Bought by
Bank Of New York
Purchase Details
Closed on
Sep 20, 2000
Sold by
Miller Randy K and Miller Shelly B
Bought by
Funderburke Robert L and Funderburke Frances E
Home Financials for this Owner
Home Financials are based on the most recent Mortgage that was taken out on this home.
Original Mortgage
$45,900
Interest Rate
8.05%
Create a Home Valuation Report for This Property
The Home Valuation Report is an in-depth analysis detailing your home's value as well as a comparison with similar homes in the area
Home Values in the Area
Average Home Value in this Area
Purchase History
| Date | Buyer | Sale Price | Title Company |
|---|---|---|---|
| Elders Lisa Howard | -- | None Listed On Document | |
| Elders Lisa Howard | -- | None Available | |
| Elders Lisa H | $14,500 | Us Land Title | |
| Bank Of New York | $19,800 | None Available | |
| Funderburke Robert L | $51,000 | -- |
Source: Public Records
Mortgage History
| Date | Status | Borrower | Loan Amount |
|---|---|---|---|
| Previous Owner | Funderburke Robert L | $45,900 |
Source: Public Records
Tax History Compared to Growth
Tax History
| Year | Tax Paid | Tax Assessment Tax Assessment Total Assessment is a certain percentage of the fair market value that is determined by local assessors to be the total taxable value of land and additions on the property. | Land | Improvement |
|---|---|---|---|---|
| 2025 | $1,076 | $100,630 | $14,000 | $86,630 |
| 2024 | $1,076 | $100,630 | $14,000 | $86,630 |
| 2023 | $1,087 | $100,630 | $14,000 | $86,630 |
| 2022 | $535 | $40,240 | $10,000 | $30,240 |
| 2021 | $543 | $40,240 | $10,000 | $30,240 |
| 2019 | $547 | $40,240 | $10,000 | $30,240 |
| 2018 | $445 | $31,815 | $9,600 | $22,215 |
| 2017 | $432 | $30,831 | $9,600 | $21,231 |
| 2016 | $432 | $30,831 | $0 | $0 |
| 2014 | $557 | $39,819 | $16,500 | $23,319 |
Source: Public Records
Map
Nearby Homes
- 105 Venus St
- 2529 Crescent Ln
- 2403 Mary Ave
- 2317 Milton Ave
- 1027 Brown St
- 2872 Unity Ave
- 2108 Twin Ave
- 415 White St
- 2925 Crescent Ln
- 1759 Smith Ave
- 912 Hallmark Dr
- 117 Bolding St
- 3431 W Franklin Blvd
- 948 Shannon Bradley Rd
- 510 Shannon Bradley Rd
- 208 S Myrtle School Rd
- 95 May St
- 79 May St
- 304 S Vine St
- 2600 Stagbuck Dr
- 2510 Crescent Ln
- 2512 Crescent Ln
- 2507 Crescent Ln
- 2514 Crescent Ln
- 2503 Crescent Ln
- 2410 Crescent Ln
- 2511 Crescent Ln
- 2501 Crescent Ln
- 2516 Crescent Ln
- 2513 Crescent Ln
- 109 Venus St
- 2515 Crescent Ln
- 107 Venus St
- 2409 Crescent Ln
- 407 Digh St
- 2518 Crescent Ln
- 2407 Crescent Ln
- 2518 Mary Ave
- 2517 Crescent Ln
- 101 Venus St