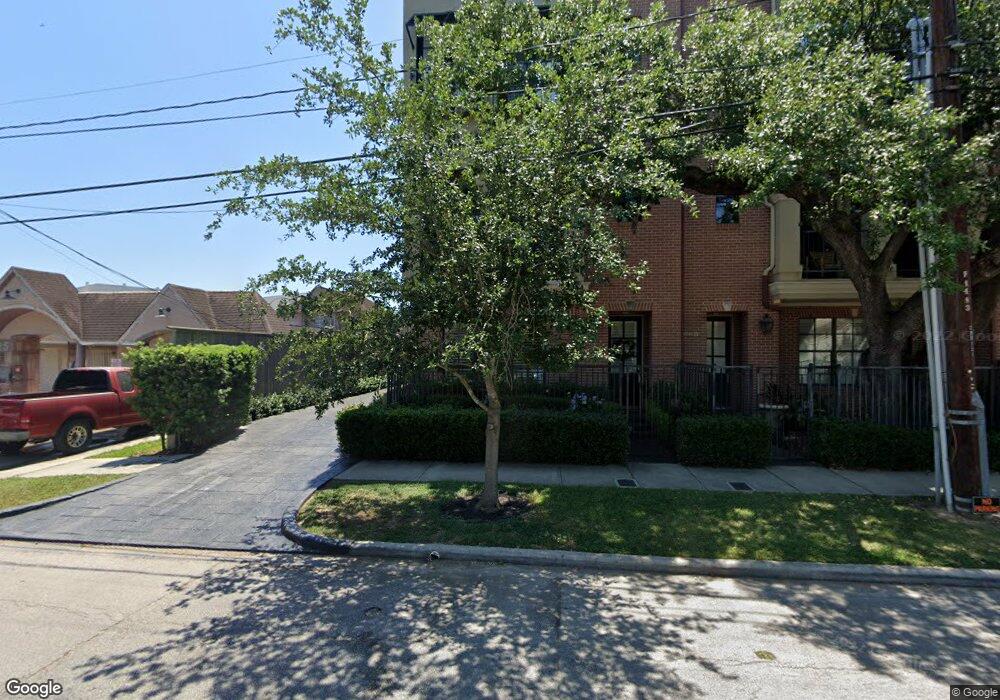
2508 Mandell St Unit B Houston, TX 77006
Montrose NeighborhoodEstimated Value: $669,000 - $790,000
3
Beds
4
Baths
2,489
Sq Ft
$290/Sq Ft
Est. Value
About This Home
This home is located at 2508 Mandell St Unit B, Houston, TX 77006 and is currently estimated at $722,705, approximately $290 per square foot. 2508 Mandell St Unit B is a home located in Harris County with nearby schools including Baker Montessori, Lanier Middle School, and Lamar High School.
Ownership History
Date
Name
Owned For
Owner Type
Purchase Details
Closed on
Jun 1, 2022
Sold by
Milgrom Sarah A
Bought by
Mike-Mayer Henrik and Mike-Mayer Theresa
Current Estimated Value
Home Financials for this Owner
Home Financials are based on the most recent Mortgage that was taken out on this home.
Original Mortgage
$572,000
Outstanding Balance
$543,447
Interest Rate
5.1%
Mortgage Type
New Conventional
Estimated Equity
$179,258
Purchase Details
Closed on
Jul 13, 2020
Sold by
Milgrom Sarah and Flores Jose S
Bought by
Flores Jose S and Milgrom Sarah A
Purchase Details
Closed on
Sep 4, 2015
Sold by
2508 Mandell Townhomes Llc
Bought by
Milgrom Sarah
Home Financials for this Owner
Home Financials are based on the most recent Mortgage that was taken out on this home.
Original Mortgage
$629,850
Interest Rate
4.08%
Mortgage Type
New Conventional
Create a Home Valuation Report for This Property
The Home Valuation Report is an in-depth analysis detailing your home's value as well as a comparison with similar homes in the area
Home Values in the Area
Average Home Value in this Area
Purchase History
| Date | Buyer | Sale Price | Title Company |
|---|---|---|---|
| Mike-Mayer Henrik | -- | None Listed On Document | |
| Mike-Mayer Henrik | -- | Chicago Title Company | |
| Flores Jose S | -- | None Available | |
| Milgrom Sarah | -- | Stewart Title |
Source: Public Records
Mortgage History
| Date | Status | Borrower | Loan Amount |
|---|---|---|---|
| Open | Mike-Mayer Henrik | $572,000 | |
| Previous Owner | Milgrom Sarah | $629,850 |
Source: Public Records
Tax History Compared to Growth
Tax History
| Year | Tax Paid | Tax Assessment Tax Assessment Total Assessment is a certain percentage of the fair market value that is determined by local assessors to be the total taxable value of land and additions on the property. | Land | Improvement |
|---|---|---|---|---|
| 2025 | $14,047 | $721,456 | $146,015 | $575,441 |
| 2024 | $14,047 | $671,367 | $138,330 | $533,037 |
| 2023 | $14,047 | $689,336 | $138,330 | $551,006 |
| 2022 | $13,484 | $612,361 | $138,330 | $474,031 |
| 2021 | $13,910 | $579,712 | $138,330 | $441,382 |
| 2020 | $12,689 | $606,776 | $138,330 | $468,446 |
| 2019 | $14,192 | $560,834 | $107,206 | $453,628 |
| 2018 | $11,498 | $603,596 | $126,803 | $476,793 |
| 2017 | $11,958 | $603,596 | $126,803 | $476,793 |
| 2016 | $17,520 | $660,236 | $126,803 | $533,433 |
| 2015 | $2,173 | $301,426 | $109,896 | $191,530 |
| 2014 | $2,173 | $0 | $0 | $0 |
Source: Public Records
Map
Nearby Homes
- 2506 Mandell St Unit 3
- 2413 Ralph St Unit 2
- 1724 Cherryhurst St
- 1709 Haver St
- 1660 Hawthorne St
- 1621 Cherryhurst St
- 1621 Haver St
- 1620 Harold St
- 2415 Elmen St
- 1701 Hawthorne St
- 1621 California St
- 1705 Michigan St
- 1728 Michigan St Unit A
- 1728 Michigan St Unit C
- 1612 Kipling St
- 1660 Kipling St
- 1503 Harold St
- 1515 Hyde Park Blvd Unit 2
- 1515 Hyde Park Blvd Unit 1
- 1515 Hyde Park Blvd Unit 14
- 2508 Mandell St
- 2508 Mandell St Unit A
- 2508 Mandell St Unit C
- 2508 Mandell St Unit D
- 2508 Mandell St Unit B
- 2508 Mandell St
- 2508 Mandell St
- 2506 Mandell St Unit 5
- 2506 Mandell St Unit 10
- 2506 Mandell St Unit 9
- 2506 Mandell St Unit 8
- 2506 Mandell St Unit 7
- 2506 Mandell St Unit 6
- 2506 Mandell St Unit 1
- 2506 Mandell St Unit 2
- 2506 Mandell St Unit 4
- 2510 Mandell St Unit C
- 2510 Mandell St Unit B
- 2510 Mandell St Unit A
- 2413 Ralph St Unit 7