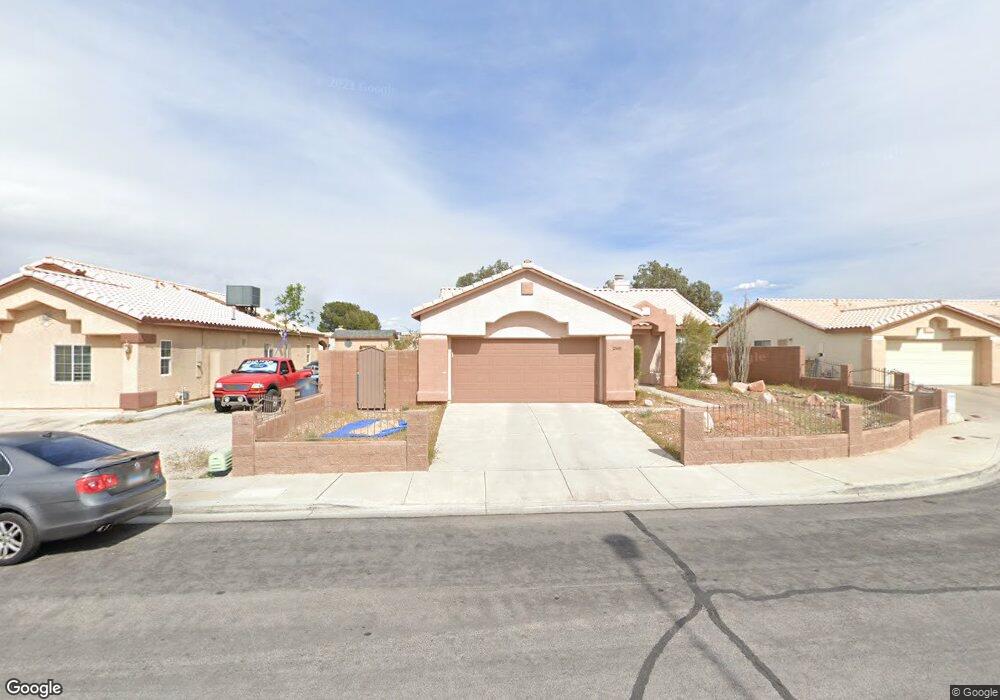
2508 Morlang Ct Las Vegas, NV 89108
Michael Way NeighborhoodEstimated Value: $394,244 - $429,000
3
Beds
2
Baths
1,465
Sq Ft
$286/Sq Ft
Est. Value
About This Home
This home is located at 2508 Morlang Ct, Las Vegas, NV 89108 and is currently estimated at $419,311, approximately $286 per square foot. 2508 Morlang Ct is a home located in Clark County with nearby schools including Berkeley L. Bunker Elementary School, J. Harold Brinley Middle School, and Cimarron Memorial High School.
Ownership History
Date
Name
Owned For
Owner Type
Purchase Details
Closed on
Jun 4, 2010
Sold by
Fleming Deborah A
Bought by
Fredrickson Kari L
Current Estimated Value
Home Financials for this Owner
Home Financials are based on the most recent Mortgage that was taken out on this home.
Original Mortgage
$139,455
Outstanding Balance
$93,738
Interest Rate
5.03%
Mortgage Type
FHA
Estimated Equity
$325,573
Purchase Details
Closed on
Feb 25, 1994
Sold by
R C Development Partnership
Bought by
Fleming Deborah A
Create a Home Valuation Report for This Property
The Home Valuation Report is an in-depth analysis detailing your home's value as well as a comparison with similar homes in the area
Home Values in the Area
Average Home Value in this Area
Purchase History
| Date | Buyer | Sale Price | Title Company |
|---|---|---|---|
| Fredrickson Kari L | $135,000 | Equity Title Of Nevada | |
| Fleming Deborah A | -- | Land Title |
Source: Public Records
Mortgage History
| Date | Status | Borrower | Loan Amount |
|---|---|---|---|
| Open | Fredrickson Kari L | $139,455 |
Source: Public Records
Tax History Compared to Growth
Tax History
| Year | Tax Paid | Tax Assessment Tax Assessment Total Assessment is a certain percentage of the fair market value that is determined by local assessors to be the total taxable value of land and additions on the property. | Land | Improvement |
|---|---|---|---|---|
| 2025 | $1,920 | $78,893 | $30,800 | $48,093 |
| 2024 | $1,778 | $78,893 | $30,800 | $48,093 |
| 2023 | $1,778 | $76,652 | $30,800 | $45,852 |
| 2022 | $1,647 | $66,798 | $24,850 | $41,948 |
| 2021 | $1,525 | $63,201 | $23,100 | $40,101 |
| 2020 | $1,413 | $60,268 | $20,300 | $39,968 |
| 2019 | $1,324 | $56,369 | $16,800 | $39,569 |
| 2018 | $1,264 | $54,508 | $16,450 | $38,058 |
| 2017 | $1,735 | $52,937 | $14,350 | $38,587 |
| 2016 | $1,184 | $49,370 | $9,800 | $39,570 |
| 2015 | $1,181 | $47,577 | $8,400 | $39,177 |
| 2014 | $1,146 | $35,914 | $5,950 | $29,964 |
Source: Public Records
Map
Nearby Homes
- 2512 Rialto Rd
- 6204 Robin Hood Cir
- 2499 N Jones Blvd
- 6316 Portola Rd
- 2405 Valparaiso St
- 6231 Santa Maria Ave
- 5807 Madre Mesa Dr
- 5905 Paseo Montana
- 6400 Deadwood Rd
- 2870 Maverick St
- 6120 Rosalita Ave
- 2536 Charteroak St
- 2513 Calico St
- 5905 Smoke Ranch Rd Unit A
- 2632 Ironside Dr
- 2879 N Jones Blvd
- 5917 Smoke Ranch Rd Unit B
- 2433 Cycad Tree St
- 6428 Deadwood Rd
- 2624 Shakespeare Rd
- 2512 Morlang Ct
- 2504 Morlang Ct
- 2509 Tanbark Ct
- 2513 Tanbark Ct
- 2513 Tanbark Ct
- 2500 Morlang Ct
- 2509 Morlang Ct
- 2505 Morlang Ct
- 2513 Morlang Ct
- 2501 Morlang Ct
- 2501 Tanbark Ct
- 2504 Maverick St
- 2508 Maverick St
- 2512 Tanbark Ct
- 2508 Tanbark Ct
- 2512 Maverick St
- 2500 Maverick St
- 2504 Tanbark Ct
- 2500 Tanbark Ct
- 6130 W Cartier Ave