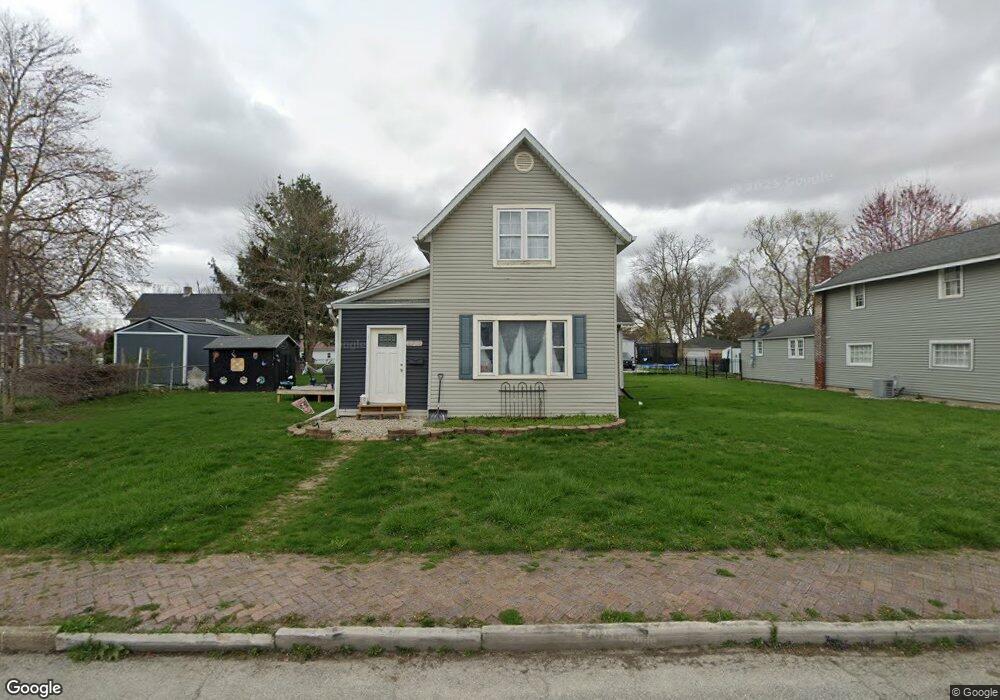
2508 N A St Elwood, IN 46036
Estimated Value: $74,000 - $161,000
3
Beds
1
Bath
1,873
Sq Ft
$66/Sq Ft
Est. Value
About This Home
This home is located at 2508 N A St, Elwood, IN 46036 and is currently estimated at $124,273, approximately $66 per square foot. 2508 N A St is a home located in Madison County with nearby schools including Elwood Elementary School, Elwood Intermediate School, and Elwood Junior-Senior High School.
Ownership History
Date
Name
Owned For
Owner Type
Purchase Details
Closed on
Jan 20, 2009
Sold by
Nationstar Mortgage Llc
Bought by
Young Miranda R
Current Estimated Value
Home Financials for this Owner
Home Financials are based on the most recent Mortgage that was taken out on this home.
Original Mortgage
$26,530
Outstanding Balance
$16,515
Interest Rate
5.06%
Mortgage Type
New Conventional
Estimated Equity
$107,758
Purchase Details
Closed on
Mar 12, 2008
Sold by
Bartlett Tevis and Bartlett Katrina
Bought by
Nationstar Mortgage Llc and Centex Home Equity Co Llc
Create a Home Valuation Report for This Property
The Home Valuation Report is an in-depth analysis detailing your home's value as well as a comparison with similar homes in the area
Home Values in the Area
Average Home Value in this Area
Purchase History
| Date | Buyer | Sale Price | Title Company |
|---|---|---|---|
| Young Miranda R | $24,500 | -- | |
| Nationstar Mortgage Llc | -- | -- |
Source: Public Records
Mortgage History
| Date | Status | Borrower | Loan Amount |
|---|---|---|---|
| Open | Young Miranda R | $26,530 |
Source: Public Records
Tax History Compared to Growth
Tax History
| Year | Tax Paid | Tax Assessment Tax Assessment Total Assessment is a certain percentage of the fair market value that is determined by local assessors to be the total taxable value of land and additions on the property. | Land | Improvement |
|---|---|---|---|---|
| 2025 | $556 | $55,600 | $7,800 | $47,800 |
| 2024 | $556 | $55,600 | $7,800 | $47,800 |
| 2023 | $514 | $50,800 | $7,400 | $43,400 |
| 2022 | $483 | $50,300 | $6,900 | $43,400 |
| 2021 | $425 | $45,300 | $6,700 | $38,600 |
| 2020 | $396 | $41,800 | $6,200 | $35,600 |
| 2019 | $397 | $40,800 | $6,200 | $34,600 |
| 2018 | $369 | $38,800 | $6,200 | $32,600 |
| 2017 | $343 | $38,400 | $6,200 | $32,200 |
| 2016 | $344 | $37,500 | $6,100 | $31,400 |
| 2014 | $326 | $38,500 | $6,200 | $32,300 |
| 2013 | $326 | $38,500 | $6,200 | $32,300 |
Source: Public Records
Map
Nearby Homes