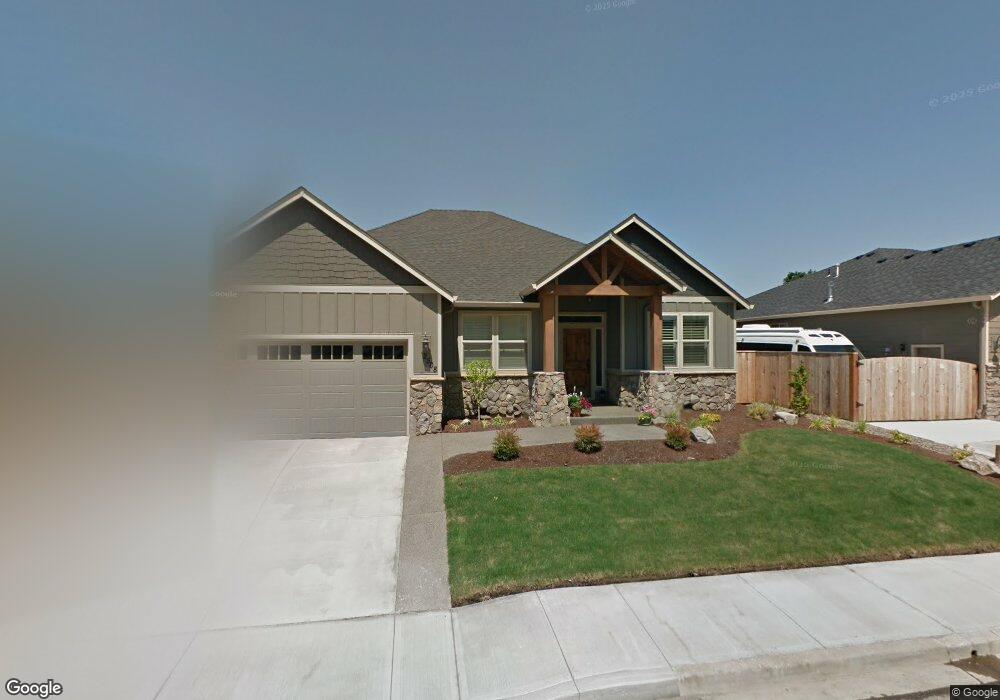
2508 NE 174th St Ridgefield, WA 98642
Estimated Value: $681,760 - $866,000
3
Beds
2
Baths
1,928
Sq Ft
$388/Sq Ft
Est. Value
About This Home
This home is located at 2508 NE 174th St, Ridgefield, WA 98642 and is currently estimated at $747,190, approximately $387 per square foot. 2508 NE 174th St is a home located in Clark County with nearby schools including Ridgefield High School, The Gardner School of Arts & Sciences, and Cedar Tree Classical Christian School.
Ownership History
Date
Name
Owned For
Owner Type
Purchase Details
Closed on
Feb 29, 2012
Sold by
Bella Villa Homes Corporation
Bought by
Ticen William H and Ticen Cyndi A
Current Estimated Value
Home Financials for this Owner
Home Financials are based on the most recent Mortgage that was taken out on this home.
Original Mortgage
$316,736
Outstanding Balance
$216,326
Interest Rate
3.75%
Mortgage Type
FHA
Estimated Equity
$530,864
Purchase Details
Closed on
Dec 14, 2011
Sold by
Arrell Richard G
Bought by
Bella Villa Homes Corporation
Create a Home Valuation Report for This Property
The Home Valuation Report is an in-depth analysis detailing your home's value as well as a comparison with similar homes in the area
Home Values in the Area
Average Home Value in this Area
Purchase History
| Date | Buyer | Sale Price | Title Company |
|---|---|---|---|
| Ticen William H | $325,000 | Fidelity National Title | |
| Bella Villa Homes Corporation | $80,100 | Fidelity National Title |
Source: Public Records
Mortgage History
| Date | Status | Borrower | Loan Amount |
|---|---|---|---|
| Open | Ticen William H | $316,736 |
Source: Public Records
Tax History Compared to Growth
Tax History
| Year | Tax Paid | Tax Assessment Tax Assessment Total Assessment is a certain percentage of the fair market value that is determined by local assessors to be the total taxable value of land and additions on the property. | Land | Improvement |
|---|---|---|---|---|
| 2025 | $6,015 | $693,407 | $225,600 | $467,807 |
| 2024 | $5,880 | $626,124 | $225,600 | $400,524 |
| 2023 | $5,748 | $662,313 | $239,512 | $422,801 |
| 2022 | $5,480 | $622,460 | $220,900 | $401,560 |
| 2021 | $5,509 | $509,985 | $137,750 | $372,235 |
| 2020 | $5,296 | $476,539 | $131,100 | $345,439 |
| 2019 | $5,223 | $463,759 | $131,100 | $332,659 |
| 2018 | $5,384 | $462,706 | $0 | $0 |
| 2017 | $4,447 | $410,872 | $0 | $0 |
| 2016 | $4,252 | $384,202 | $0 | $0 |
| 2015 | $4,041 | $352,179 | $0 | $0 |
| 2014 | -- | $324,765 | $0 | $0 |
| 2013 | -- | $306,726 | $0 | $0 |
Source: Public Records
Map
Nearby Homes
- 17704 NE 26th Ct Unit Lot 4
- 17708 NE 26th Ct Unit Lot 3
- 2503 NE 178th St
- 17711 NE 25th Ct Unit LOT 8
- 17716 NE 26th Ct
- 2217 NE 179th St Unit L22
- 3609 NE 170th St
- 3100 NE 171st St
- 17318 NE 19th Dr
- 3615 NE 169th Way
- 3619 NE 169th Way
- 2617 NE 166th St
- 1614 NE 172nd Cir
- 16912 NE 17th Ave
- 2514 NE 163rd St
- 3620 NE 168th St
- 3608 NE 170th St
- 3616 NE 168th St
- 3604 170th St
- 3614 NE 169th Way
- 2512 NE 174th St
- 2504 NE 174th St
- 0 NE 27th Ave Unit 658264
- 0 NE 27th Ave Unit 9036188
- 2516 NE 174th St
- 2500 NE 174th St
- 2502 NE 175th St
- 2508 NE 175th St
- 2507 NE 174th St
- 2619 NE 175th St
- 2612 NE 175th St
- 17502 NE 25th Ave
- 2506 NE 175th St
- 2510 NE 175th St
- 2609 NE 175th St
- 2503 NE 174th St
- 2600 NE 175th St
- 17506 NE 25th Ave
- 2507 NE 176th St
- 2503 NE 176th St