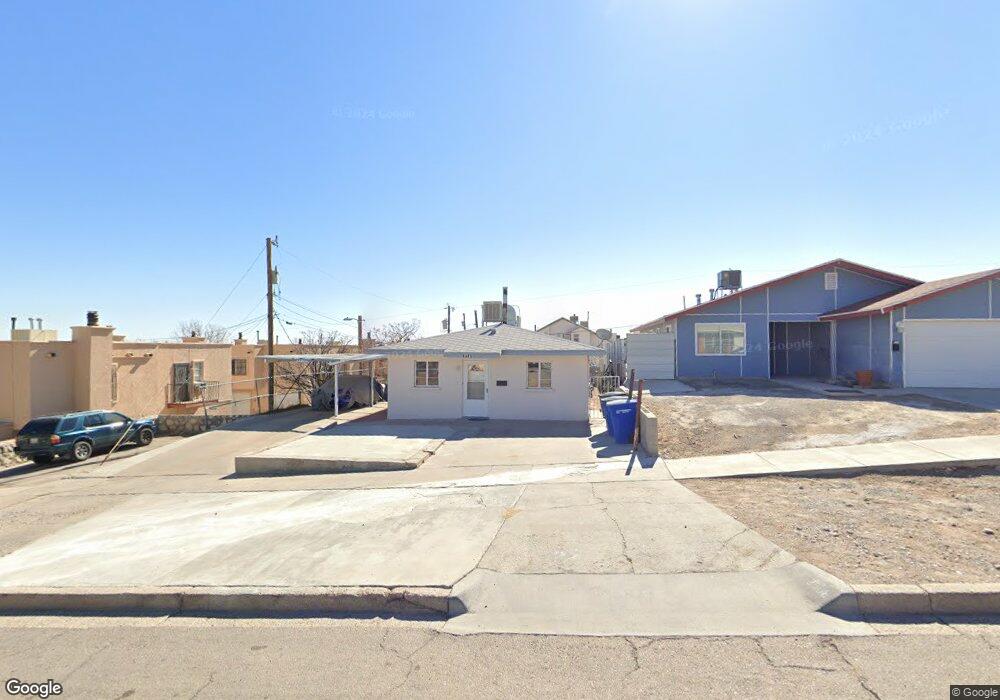
2508 San Jose Ave Unit 2510 El Paso, TX 79930
Highland Park NeighborhoodEstimated Value: $199,434 - $278,000
4
Beds
2
Baths
1,500
Sq Ft
$162/Sq Ft
Est. Value
About This Home
This home is located at 2508 San Jose Ave Unit 2510, El Paso, TX 79930 and is currently estimated at $242,359, approximately $161 per square foot. 2508 San Jose Ave Unit 2510 is a home located in El Paso County with nearby schools including Moreno Elementary School, Armendariz Middle School, and Middle School-5 NW Middle.
Ownership History
Date
Name
Owned For
Owner Type
Purchase Details
Closed on
Sep 1, 2012
Sold by
Milliken Richard and Milliken Patricia D
Bought by
Milliken Theodore R
Current Estimated Value
Home Financials for this Owner
Home Financials are based on the most recent Mortgage that was taken out on this home.
Original Mortgage
$72,953
Outstanding Balance
$50,528
Interest Rate
3.59%
Mortgage Type
Seller Take Back
Estimated Equity
$191,831
Purchase Details
Closed on
Jul 22, 2009
Sold by
Delgado Carmen Trejo
Bought by
Milliken Properties
Home Financials for this Owner
Home Financials are based on the most recent Mortgage that was taken out on this home.
Original Mortgage
$88,500
Interest Rate
5.71%
Mortgage Type
Purchase Money Mortgage
Purchase Details
Closed on
May 24, 2005
Sold by
Trejo Candelario
Bought by
Delgado Carmen Trejo
Create a Home Valuation Report for This Property
The Home Valuation Report is an in-depth analysis detailing your home's value as well as a comparison with similar homes in the area
Home Values in the Area
Average Home Value in this Area
Purchase History
| Date | Buyer | Sale Price | Title Company |
|---|---|---|---|
| Milliken Theodore R | -- | None Available | |
| Milliken Properties | -- | None Available | |
| Delgado Carmen Trejo | -- | -- |
Source: Public Records
Mortgage History
| Date | Status | Borrower | Loan Amount |
|---|---|---|---|
| Open | Milliken Theodore R | $72,953 | |
| Closed | Milliken Properties | $88,500 |
Source: Public Records
Tax History Compared to Growth
Tax History
| Year | Tax Paid | Tax Assessment Tax Assessment Total Assessment is a certain percentage of the fair market value that is determined by local assessors to be the total taxable value of land and additions on the property. | Land | Improvement |
|---|---|---|---|---|
| 2025 | $3,047 | $117,398 | $27,900 | $89,498 |
| 2024 | $3,047 | $117,398 | $27,900 | $89,498 |
| 2023 | $3,091 | $111,748 | $20,460 | $91,288 |
| 2022 | $3,308 | $111,748 | $20,460 | $91,288 |
| 2021 | $2,638 | $84,503 | $20,460 | $64,043 |
| 2020 | $3,011 | $97,967 | $13,860 | $84,107 |
| 2018 | $2,524 | $85,271 | $13,860 | $71,411 |
| 2017 | $2,429 | $86,230 | $13,860 | $72,370 |
| 2016 | $2,582 | $91,677 | $13,860 | $77,817 |
| 2015 | $2,509 | $91,677 | $13,860 | $77,817 |
| 2014 | $2,509 | $91,677 | $13,860 | $77,817 |
Source: Public Records
Map
Nearby Homes
- 2520 San Jose Ave Unit 4C
- 2520 San Jose Ave Unit 4D
- 2612 San Jose Ave
- 2415 Pittsburg Ave
- 2309 San Diego Ave
- 1605 Dakota St
- 2805 Grant Ave
- 2413 Copper Ave
- 2510 Federal Ave
- 2212 Silver Ave
- 1813 & 181 Alabama St
- 1701 Elm St
- 2630 Wheeling Ave
- 1712 Elm St
- 2624 Aurora Ave
- 1229 Ohio St
- 2406 Lebanon Ave
- 2012 San Jose Ave
- 2735 Aurora Ave
- 2407 Grant Ave
- 2506 San Jose Ave
- 2500 San Jose Ave
- 2509 Portland Ave
- 1290 Kentucky St
- 2505 Portland Ave
- 2520 San Jose Ave Unit 2-B
- 2520 San Jose Ave Unit 8
- 2520 San Jose Ave Unit 8
- 2520 San Jose Ave Unit 8
- 2520 San Jose Ave Unit 8
- 2520 San Jose Ave Unit 7
- 2520 San Jose Ave Unit 7
- 2520 San Jose Ave Unit 7
- 2520 San Jose Ave Unit 7
- 2520 San Jose Ave Unit 6D
- 2520 San Jose Ave Unit 6
- 2520 San Jose Ave Unit 6
- 2520 San Jose Ave Unit 6
- 2520 San Jose Ave Unit 5
- 2520 San Jose Ave Unit 5