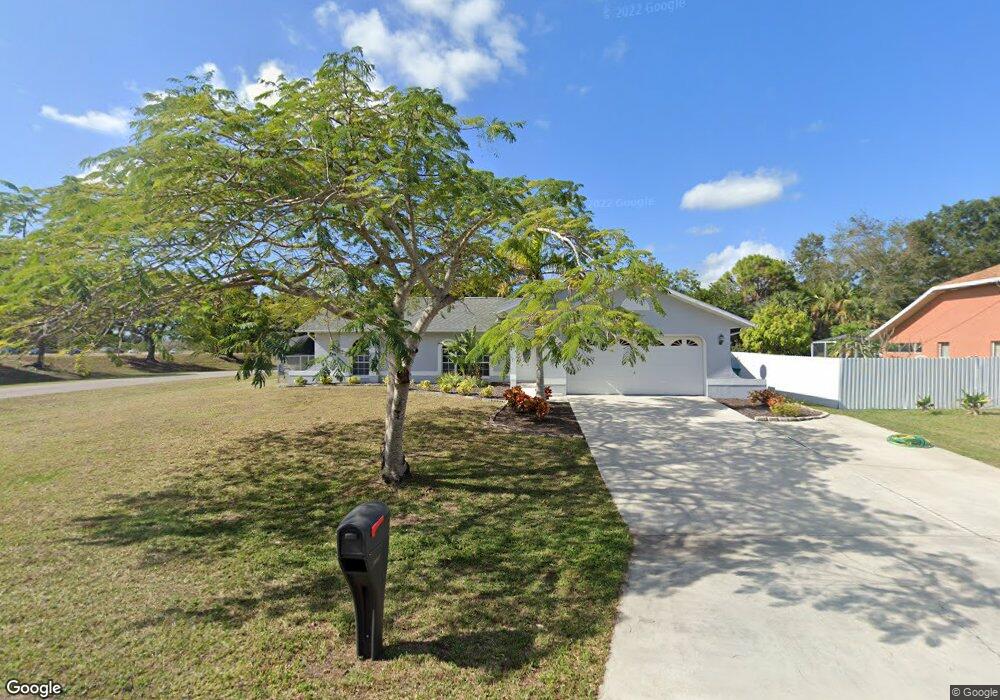
2508 SE 8th Place Cape Coral, FL 33904
Caloosahatchee NeighborhoodEstimated Value: $331,659 - $362,000
3
Beds
2
Baths
2,048
Sq Ft
$167/Sq Ft
Est. Value
About This Home
This home is located at 2508 SE 8th Place, Cape Coral, FL 33904 and is currently estimated at $342,665, approximately $167 per square foot. 2508 SE 8th Place is a home located in Lee County with nearby schools including Caloosa Elementary School, Cape Elementary School, and Tropic Isles Elementary School.
Ownership History
Date
Name
Owned For
Owner Type
Purchase Details
Closed on
Jun 20, 2012
Sold by
Hensley Wayne and Guth Robert
Bought by
Arrieta Iliana Rosa Pena
Current Estimated Value
Purchase Details
Closed on
Jan 17, 2012
Sold by
Pena Manuel M and Pena Lydia E
Bought by
Hensley Wayne and Guth Robert
Purchase Details
Closed on
Jun 25, 2002
Sold by
Bankers Tr Co Ca N A
Bought by
Pena Manuel M and Pena Lydia E
Home Financials for this Owner
Home Financials are based on the most recent Mortgage that was taken out on this home.
Original Mortgage
$85,000
Interest Rate
6.75%
Purchase Details
Closed on
Dec 30, 1999
Sold by
Mcgregor Homes Inc
Bought by
Lemm Karl J and Lemm Debra S
Home Financials for this Owner
Home Financials are based on the most recent Mortgage that was taken out on this home.
Original Mortgage
$85,400
Interest Rate
7.68%
Purchase Details
Closed on
May 15, 1999
Sold by
Mccann Lillian
Bought by
Mcgregor Homes Inc
Create a Home Valuation Report for This Property
The Home Valuation Report is an in-depth analysis detailing your home's value as well as a comparison with similar homes in the area
Home Values in the Area
Average Home Value in this Area
Purchase History
| Date | Buyer | Sale Price | Title Company |
|---|---|---|---|
| Arrieta Iliana Rosa Pena | $132,900 | Security Title & Abstract Ll | |
| Hensley Wayne | $72,000 | Security Title & Abstract Ll | |
| Hensley Wayne | $72,000 | Security Title & Abstract Ll | |
| Pena Manuel M | $95,000 | -- | |
| Lemm Karl J | $122,000 | -- | |
| Mcgregor Homes Inc | $4,000 | -- |
Source: Public Records
Mortgage History
| Date | Status | Borrower | Loan Amount |
|---|---|---|---|
| Previous Owner | Pena Manuel M | $85,000 | |
| Previous Owner | Lemm Karl J | $85,400 |
Source: Public Records
Tax History Compared to Growth
Tax History
| Year | Tax Paid | Tax Assessment Tax Assessment Total Assessment is a certain percentage of the fair market value that is determined by local assessors to be the total taxable value of land and additions on the property. | Land | Improvement |
|---|---|---|---|---|
| 2025 | $2,334 | $137,221 | -- | -- |
| 2024 | $2,334 | $133,354 | -- | -- |
| 2023 | $2,204 | $129,470 | $0 | $0 |
| 2022 | $2,007 | $125,699 | $0 | $0 |
| 2021 | $1,983 | $198,739 | $29,648 | $169,091 |
| 2020 | $1,986 | $120,353 | $0 | $0 |
| 2019 | $1,918 | $117,647 | $0 | $0 |
| 2018 | $1,897 | $115,453 | $0 | $0 |
| 2017 | $1,875 | $113,078 | $0 | $0 |
| 2016 | $1,815 | $148,606 | $17,712 | $130,894 |
| 2015 | $1,806 | $129,795 | $14,995 | $114,800 |
| 2014 | $1,760 | $117,793 | $14,913 | $102,880 |
| 2013 | -- | $107,497 | $12,176 | $95,321 |
Source: Public Records
Map
Nearby Homes
- 2501 Academy Blvd
- 2416 SE 8th Ave
- 2419 Country Club Blvd
- 2326 SE 8th Ave
- 624 SE 23rd Terrace
- 1008 SE 25th Terrace
- 1015 SE 25th Ln
- 2728 SE 8th Ave
- 627 SE 22nd Terrace
- 524 SE 26th Terrace
- 1449 SE 22nd St
- 620 SE 22nd St
- 517 SE 27th St
- 2807 Country Club Blvd
- 539 W Archer Pkwy
- 513 SE 27th Terrace
- 610 W Archer Pkwy
- 2201 SE 10th Ave
- 605 SE 22nd St
- 2221 SE 5th Place
- 2504 SE 8th Place
- 2510 SE 8th Ave
- 2506 SE 8th Ave
- 2420 SE 8th Place
- 2502 Country Club Blvd
- 2419 SE 8th Ave
- 2419 SE 8th Place
- 2505 Academy Blvd
- 2509 Academy Blvd
- 2420 SE 8th Ave
- 2513 Academy Blvd
- 2415 SE 8th Place
- 2420 Country Club Blvd
- 2517 Academy Blvd
- 2412 SE 8th Place
- 2411 SE 8th Ave
- 2416 Country Club Blvd
- 2411 SE 8th Place
- 2419 Academy Blvd