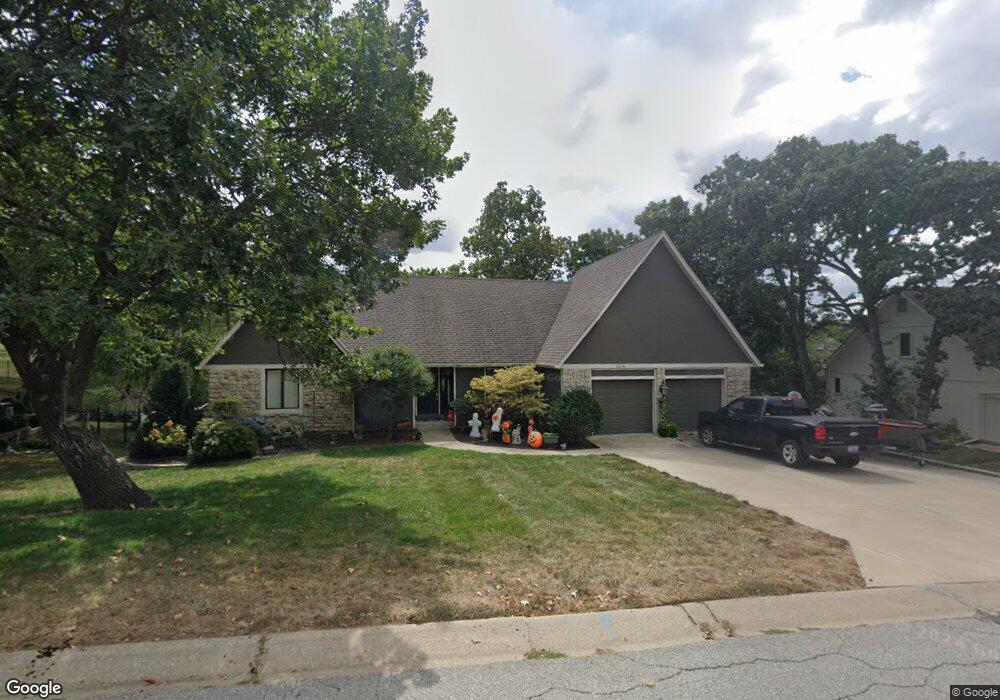
2508 SW Still Meadows Ln Blue Springs, MO 64015
Estimated Value: $381,000 - $512,759
3
Beds
2
Baths
2,584
Sq Ft
$180/Sq Ft
Est. Value
About This Home
This home is located at 2508 SW Still Meadows Ln, Blue Springs, MO 64015 and is currently estimated at $464,440, approximately $179 per square foot. 2508 SW Still Meadows Ln is a home located in Jackson County with nearby schools including Franklin Smith Elementary School, Moreland Ridge Middle School, and Blue Springs South High School.
Ownership History
Date
Name
Owned For
Owner Type
Purchase Details
Closed on
Jun 3, 2013
Sold by
Gum Charles David and Gum Becky
Bought by
Gum Charles David and Gum Becky
Current Estimated Value
Home Financials for this Owner
Home Financials are based on the most recent Mortgage that was taken out on this home.
Original Mortgage
$210,718
Outstanding Balance
$45,119
Interest Rate
2.64%
Mortgage Type
New Conventional
Estimated Equity
$419,321
Purchase Details
Closed on
Mar 14, 2007
Sold by
Gum Charles D
Bought by
Gum Charles D and Moore Becky
Home Financials for this Owner
Home Financials are based on the most recent Mortgage that was taken out on this home.
Original Mortgage
$224,175
Interest Rate
6.32%
Mortgage Type
Purchase Money Mortgage
Purchase Details
Closed on
Nov 12, 2001
Sold by
Moore Kenneth W and Moore Nancy
Bought by
Moore Jennifer Lynn and Moore Stacey Ann
Create a Home Valuation Report for This Property
The Home Valuation Report is an in-depth analysis detailing your home's value as well as a comparison with similar homes in the area
Home Values in the Area
Average Home Value in this Area
Purchase History
| Date | Buyer | Sale Price | Title Company |
|---|---|---|---|
| Gum Charles David | -- | Town And Country Title | |
| Gum Charles D | -- | Cbkc Title & Escrow Llc | |
| Gum Charles D | -- | Cbkc Title & Escrow Llc | |
| Moore Jennifer Lynn | -- | -- |
Source: Public Records
Mortgage History
| Date | Status | Borrower | Loan Amount |
|---|---|---|---|
| Open | Gum Charles David | $210,718 | |
| Closed | Gum Charles D | $224,175 |
Source: Public Records
Tax History Compared to Growth
Tax History
| Year | Tax Paid | Tax Assessment Tax Assessment Total Assessment is a certain percentage of the fair market value that is determined by local assessors to be the total taxable value of land and additions on the property. | Land | Improvement |
|---|---|---|---|---|
| 2025 | $6,903 | $86,689 | $11,641 | $75,048 |
| 2024 | $6,770 | $84,611 | $7,853 | $76,758 |
| 2023 | $6,770 | $84,610 | $6,072 | $78,538 |
| 2022 | $5,935 | $65,550 | $9,215 | $56,335 |
| 2021 | $5,929 | $65,550 | $9,215 | $56,335 |
| 2020 | $5,301 | $59,615 | $9,215 | $50,400 |
| 2019 | $5,125 | $59,615 | $9,215 | $50,400 |
| 2018 | $4,444 | $49,755 | $5,442 | $44,313 |
| 2017 | $4,040 | $49,755 | $5,442 | $44,313 |
| 2016 | $4,040 | $45,353 | $6,384 | $38,969 |
| 2014 | $3,772 | $42,210 | $6,387 | $35,823 |
Source: Public Records
Map
Nearby Homes
- 1311 SW 25th St
- 1604 SW 21st St
- 1203 SW 26th St
- 1005 SW 23rd St
- 1604 SW 18th Street Ct
- 1804 SW Cherokee Strip
- 1900 SW Cherokee Strip
- 2413 SW Emerald Creek Place
- 1001 SW 18th St
- 1008 SW 17th St
- 1331 SW Horizon Dr
- 1201 SW Hopi St
- 1104 SW Mic-O-say Dr
- 1504 SW Sunset St
- 1004 SW Hiawatha Dr
- 1004 SW Twilight Ln
- 1103 SW Stonecreek Dr
- 3665 SW Kimstin Cir
- 2603 SW Shadow Creek Ct
- 3705 SW Kimstin Cir
- 2512 SW Still Meadows Ln
- 2504 SW Still Meadows Ln
- 1717 SW 24th St
- 1713 SW 24th St
- 2505 SW Still Meadows Ln
- 2516 SW Still Meadows Ln
- 2500 SW Still Meadows Ln
- 1721 SW 24th St
- 2509 SW Still Meadows Ln
- 1513 SW 25th St
- 1705 SW 24th St
- 1516 SW 25th St
- 1725 SW 24th St
- 2404 SW Still Meadows Ln
- 2506 SW Still Meadows Terrace
- 2520 SW Still Meadows Ln
- 1501 SW 25th St
- 1701 SW 24th St
- 2513 SW Still Meadows Ln
- 2510 SW Still Meadows Terrace