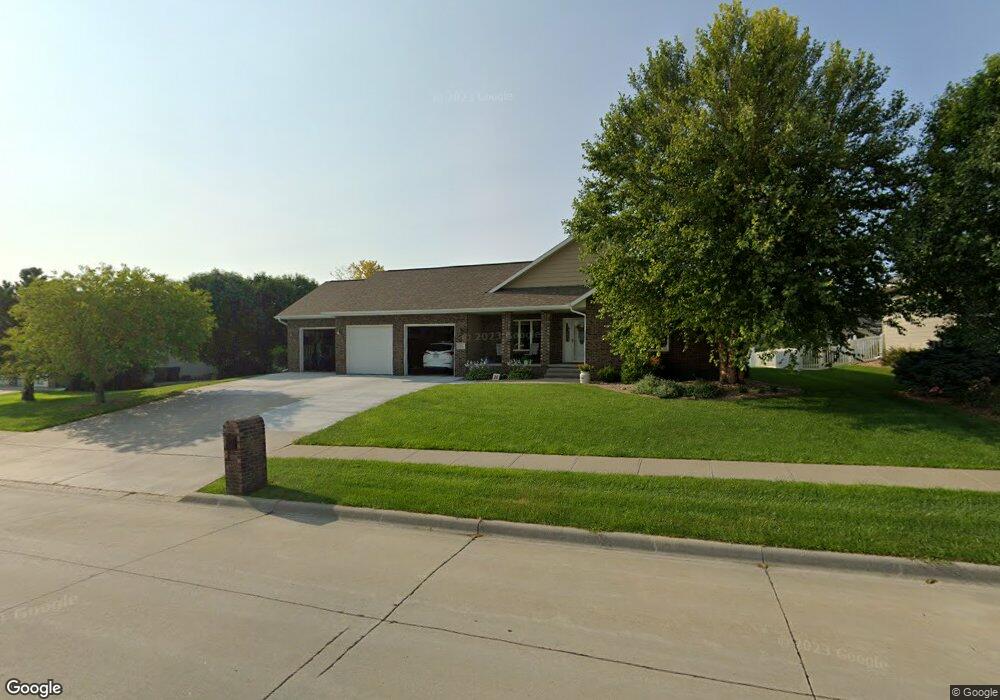
2508 W 48th St Kearney, NE 68845
Estimated Value: $476,076 - $527,000
--
Bed
--
Bath
1,828
Sq Ft
$277/Sq Ft
Est. Value
About This Home
This home is located at 2508 W 48th St, Kearney, NE 68845 and is currently estimated at $506,019, approximately $276 per square foot. 2508 W 48th St is a home located in Buffalo County with nearby schools including Windy Hills Elementary School, Horizon Middle School, and Kearney Senior High School.
Ownership History
Date
Name
Owned For
Owner Type
Purchase Details
Closed on
Oct 16, 2020
Sold by
Cavill William D and Cavill Angela L
Bought by
Nielsen Rodney J and Nielsen Kathleen
Current Estimated Value
Home Financials for this Owner
Home Financials are based on the most recent Mortgage that was taken out on this home.
Original Mortgage
$355,000
Outstanding Balance
$315,754
Interest Rate
2.9%
Mortgage Type
New Conventional
Estimated Equity
$190,265
Purchase Details
Closed on
Jun 2, 2011
Sold by
Garringer Luke and Garringer Amanda
Bought by
Cavill William D and Cavill Angela L
Home Financials for this Owner
Home Financials are based on the most recent Mortgage that was taken out on this home.
Original Mortgage
$140,000
Interest Rate
4.74%
Purchase Details
Closed on
Mar 14, 2008
Sold by
Kristopher K Kristopher K and Delehant Cheryl M
Bought by
Garringer Luke and Garringer Amanda
Create a Home Valuation Report for This Property
The Home Valuation Report is an in-depth analysis detailing your home's value as well as a comparison with similar homes in the area
Home Values in the Area
Average Home Value in this Area
Purchase History
| Date | Buyer | Sale Price | Title Company |
|---|---|---|---|
| Nielsen Rodney J | $355,000 | Nebraska Title Co | |
| Cavill William D | $261,900 | Barney | |
| Garringer Luke | -- | Barney |
Source: Public Records
Mortgage History
| Date | Status | Borrower | Loan Amount |
|---|---|---|---|
| Open | Nielsen Rodney J | $355,000 | |
| Previous Owner | Cavill William D | $140,000 | |
| Closed | Garringer Luke | $0 |
Source: Public Records
Tax History Compared to Growth
Tax History
| Year | Tax Paid | Tax Assessment Tax Assessment Total Assessment is a certain percentage of the fair market value that is determined by local assessors to be the total taxable value of land and additions on the property. | Land | Improvement |
|---|---|---|---|---|
| 2025 | $5,670 | $467,455 | $59,575 | $407,880 |
| 2024 | $5,670 | $427,305 | $57,840 | $369,465 |
| 2023 | $6,760 | $397,215 | $57,840 | $339,375 |
| 2022 | $5,961 | $339,700 | $57,215 | $282,485 |
| 2021 | $5,507 | $319,320 | $54,785 | $264,535 |
| 2020 | $5,533 | $319,880 | $54,785 | $265,095 |
| 2019 | $5,504 | $314,350 | $54,785 | $259,565 |
| 2018 | $5,296 | $306,800 | $48,900 | $257,900 |
| 2017 | $4,921 | $286,985 | $48,900 | $238,085 |
| 2016 | $4,301 | $252,910 | $48,900 | $204,010 |
| 2015 | $4,461 | $256,480 | $0 | $0 |
| 2014 | $5,322 | $279,135 | $0 | $0 |
Source: Public Records
Map
Nearby Homes
- TBD Lt 2 Block 2
- TBD Lot 1 Block 2
- TBD Lot 3 Block 2
- TBD Lot 2 Block 4
- TBD Lot 1 Block 3
- TBD Lot 2 Block 3
- 2703 W 47th St
- TBD Lot 3 Block 3
- TBD Lt 4 Block 3
- TBD Lot 11 Block 4
- TBD Lot 5 Block 3
- 4727 29th Ave
- 4732 29th Ave
- TBD Country Club Ln Unit L10B2 Spruce Hollow
- L3B3 Country Club Ln
- 2908 W 39th St
- 4312 19th Ave
- L5B1 Aspen Meadows Second Addition
- Lot 4 Hawthorne Heights Unit (3.58AC)
- TBD 28th Ave Unit L5B1 Spruce Hollow W
- 4712 Country Club Ln
- 2512 W 48th St
- 2509 W 47th St
- 2603 W 47th St
- 4704 Country Club Ln
- 2604 W 48th St
- 2507 W 48th St
- 4804 Country Club Ln
- 2511 W 48th St
- 2605 W 48th St
- 2608 W 48th St
- 2408 W 48th Street Place
- 2504 W 47th St
- L1 B2 Good Samaritan Society Kearney Village Subdivision
- 2411 W 48th Street Place
- 2508 W 47th St
- L3 B2 Good Samaritan Society Kearney Village Subdivision
- 2604 W 47th St
- 2609 W 48th St
- 2411 W 47th Street Place