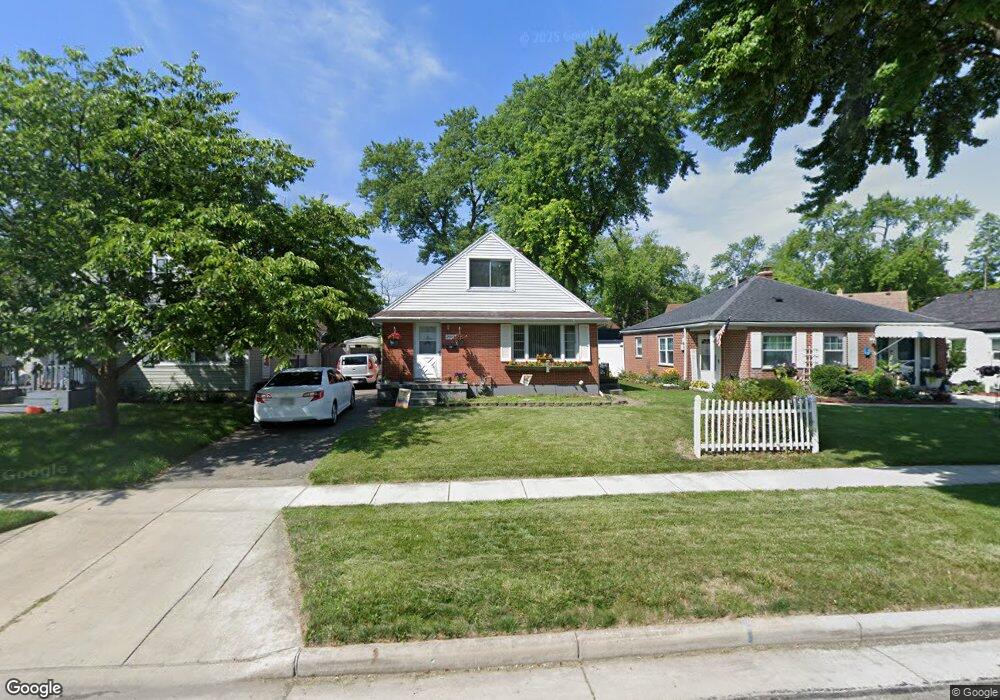
2509 Acorn Dr Dayton, OH 45419
Estimated Value: $190,000 - $225,000
3
Beds
1
Bath
1,165
Sq Ft
$173/Sq Ft
Est. Value
About This Home
This home is located at 2509 Acorn Dr, Dayton, OH 45419 and is currently estimated at $201,031, approximately $172 per square foot. 2509 Acorn Dr is a home located in Montgomery County with nearby schools including Orchard Park Elementary School, Van Buren Middle School, and Kettering Fairmont High School.
Ownership History
Date
Name
Owned For
Owner Type
Purchase Details
Closed on
Jul 28, 2003
Sold by
Johnson Karolyn S and Johnson Terence L
Bought by
Price Kevin A
Current Estimated Value
Home Financials for this Owner
Home Financials are based on the most recent Mortgage that was taken out on this home.
Original Mortgage
$7,000
Interest Rate
5.31%
Mortgage Type
Unknown
Purchase Details
Closed on
Feb 19, 1999
Sold by
Dewey Karolyn S and Dewey Karolyn S
Bought by
Johnson Karolyn S
Home Financials for this Owner
Home Financials are based on the most recent Mortgage that was taken out on this home.
Original Mortgage
$84,566
Interest Rate
6.85%
Mortgage Type
FHA
Purchase Details
Closed on
Jun 6, 1996
Sold by
Wonnell Daniel Richard and Wonnell Betty Jo
Bought by
Dewey Karolyn S
Create a Home Valuation Report for This Property
The Home Valuation Report is an in-depth analysis detailing your home's value as well as a comparison with similar homes in the area
Home Values in the Area
Average Home Value in this Area
Purchase History
| Date | Buyer | Sale Price | Title Company |
|---|---|---|---|
| Price Kevin A | $120,400 | -- | |
| Johnson Karolyn S | -- | Ati Title Agency Of Ohio Inc | |
| Dewey Karolyn S | $87,000 | -- |
Source: Public Records
Mortgage History
| Date | Status | Borrower | Loan Amount |
|---|---|---|---|
| Closed | Price Kevin A | $7,000 | |
| Closed | Price Kevin A | $96,000 | |
| Previous Owner | Johnson Karolyn S | $84,566 |
Source: Public Records
Tax History Compared to Growth
Tax History
| Year | Tax Paid | Tax Assessment Tax Assessment Total Assessment is a certain percentage of the fair market value that is determined by local assessors to be the total taxable value of land and additions on the property. | Land | Improvement |
|---|---|---|---|---|
| 2024 | $3,105 | $49,980 | $10,810 | $39,170 |
| 2023 | $3,105 | $49,980 | $10,810 | $39,170 |
| 2022 | $2,953 | $37,580 | $8,130 | $29,450 |
| 2021 | $2,731 | $37,580 | $8,130 | $29,450 |
| 2020 | $2,741 | $37,580 | $8,130 | $29,450 |
| 2019 | $2,717 | $32,960 | $7,380 | $25,580 |
| 2018 | $2,732 | $32,960 | $7,380 | $25,580 |
| 2017 | $2,794 | $32,960 | $7,380 | $25,580 |
| 2016 | $2,917 | $32,490 | $7,380 | $25,110 |
| 2015 | $2,799 | $32,490 | $7,380 | $25,110 |
| 2014 | $2,799 | $32,490 | $7,380 | $25,110 |
| 2012 | -- | $32,030 | $7,390 | $24,640 |
Source: Public Records
Map
Nearby Homes
- 2500 Oak Park Ave
- 631 Corona Ave
- 545 Monteray Ave
- 663 Broad Blvd
- 651 Broad Blvd
- 538 Wiltshire Blvd
- 1024 Ansel Dr
- 2004 Shroyer Rd
- 962 Broad Blvd
- 2119 Shroyer Rd
- 1120 Yorkshire Place
- 445 Peach Orchard Ave
- 439 Monteray Ave
- 2917 California Ave
- 436 Monteray Ave
- 1116 Hale Ave
- 1809 Shroyer Rd
- 2905 Acorn Dr
- 1622 Shroyer Rd
- 425 Orchard Dr
- 2513 Acorn Dr
- 2505 Acorn Dr
- 2517 Acorn Dr
- 2501 Acorn Dr
- 2508 California Ave
- 2504 California Ave
- 2521 Acorn Dr
- 2512 California Ave
- 2500 California Ave
- 2516 California Ave
- 2501 Oakley Ave
- 2505 Oakley Ave
- 2512 Acorn Dr
- 2520 Acorn Dr
- 2520 California Ave
- 2508 Acorn Dr
- 2524 Acorn Dr
- 2504 Acorn Dr
- 2524 California Ave
- 2528 Acorn Dr