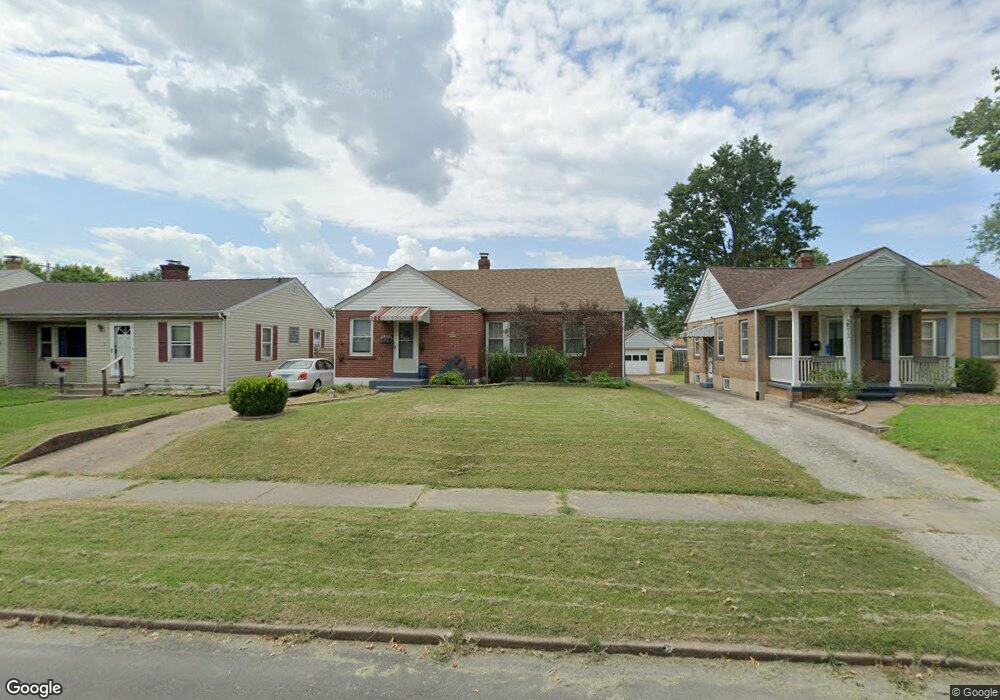
2509 Benton St Granite City, IL 62040
Estimated Value: $75,000 - $131,000
3
Beds
1
Bath
954
Sq Ft
$117/Sq Ft
Est. Value
About This Home
This home is located at 2509 Benton St, Granite City, IL 62040 and is currently estimated at $111,970, approximately $117 per square foot. 2509 Benton St is a home located in Madison County with nearby schools including Granite City High School, Metro East Montessori School, and Rivers of Life Christian School.
Ownership History
Date
Name
Owned For
Owner Type
Purchase Details
Closed on
Feb 2, 2007
Sold by
French Patricia A
Bought by
Donohue Tim M and Donohue Linda S
Current Estimated Value
Home Financials for this Owner
Home Financials are based on the most recent Mortgage that was taken out on this home.
Original Mortgage
$90,300
Outstanding Balance
$54,266
Interest Rate
6.22%
Mortgage Type
VA
Estimated Equity
$57,704
Create a Home Valuation Report for This Property
The Home Valuation Report is an in-depth analysis detailing your home's value as well as a comparison with similar homes in the area
Home Values in the Area
Average Home Value in this Area
Purchase History
| Date | Buyer | Sale Price | Title Company |
|---|---|---|---|
| Donohue Tim M | $88,500 | Abstracts & Titles Inc |
Source: Public Records
Mortgage History
| Date | Status | Borrower | Loan Amount |
|---|---|---|---|
| Open | Donohue Tim M | $90,300 |
Source: Public Records
Tax History Compared to Growth
Tax History
| Year | Tax Paid | Tax Assessment Tax Assessment Total Assessment is a certain percentage of the fair market value that is determined by local assessors to be the total taxable value of land and additions on the property. | Land | Improvement |
|---|---|---|---|---|
| 2024 | $1,265 | $37,480 | $3,710 | $33,770 |
| 2023 | $1,265 | $33,780 | $3,340 | $30,440 |
| 2022 | $1,382 | $30,950 | $3,060 | $27,890 |
| 2021 | $1,501 | $29,030 | $2,870 | $26,160 |
| 2020 | $1,535 | $27,720 | $2,740 | $24,980 |
| 2019 | $1,573 | $26,280 | $2,600 | $23,680 |
| 2018 | $1,581 | $25,510 | $2,520 | $22,990 |
| 2017 | $1,551 | $26,450 | $2,610 | $23,840 |
| 2016 | $1,624 | $26,450 | $2,610 | $23,840 |
| 2015 | $1,464 | $26,450 | $2,610 | $23,840 |
| 2014 | $1,464 | $26,450 | $2,610 | $23,840 |
| 2013 | $1,464 | $26,450 | $2,610 | $23,840 |
Source: Public Records
Map
Nearby Homes