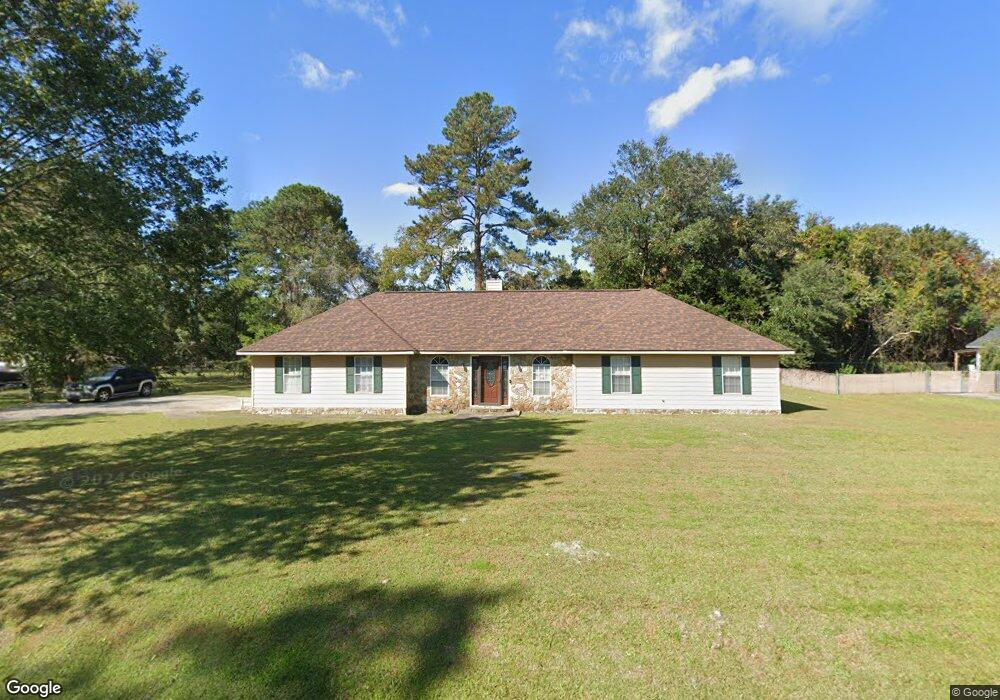
2509 Bland Rd Waycross, GA 31501
Estimated Value: $186,928 - $236,000
3
Beds
2
Baths
1,408
Sq Ft
$157/Sq Ft
Est. Value
About This Home
This home is located at 2509 Bland Rd, Waycross, GA 31501 and is currently estimated at $221,732, approximately $157 per square foot. 2509 Bland Rd is a home located in Ware County with nearby schools including Wacona Elementary School, Ware County Middle School, and Ware County High School.
Ownership History
Date
Name
Owned For
Owner Type
Purchase Details
Closed on
Apr 21, 2017
Sold by
Golden Joseph Christopher
Bought by
Williams Marquis and Williams Eboni
Current Estimated Value
Home Financials for this Owner
Home Financials are based on the most recent Mortgage that was taken out on this home.
Original Mortgage
$110,000
Outstanding Balance
$91,587
Interest Rate
4.23%
Mortgage Type
VA
Estimated Equity
$130,145
Purchase Details
Closed on
Feb 21, 2008
Sold by
Means James A
Bought by
Golden Joseph Christopher
Home Financials for this Owner
Home Financials are based on the most recent Mortgage that was taken out on this home.
Original Mortgage
$111,000
Interest Rate
5.46%
Mortgage Type
New Conventional
Purchase Details
Closed on
Aug 14, 2001
Sold by
Carter Bobby Ray
Bought by
Means James A and Means Martha P
Purchase Details
Closed on
Aug 24, 1993
Bought by
Carter Bobby Ray
Create a Home Valuation Report for This Property
The Home Valuation Report is an in-depth analysis detailing your home's value as well as a comparison with similar homes in the area
Home Values in the Area
Average Home Value in this Area
Purchase History
| Date | Buyer | Sale Price | Title Company |
|---|---|---|---|
| Williams Marquis | $110,000 | -- | |
| Golden Joseph Christopher | $111,000 | -- | |
| Means James A | $89,500 | -- | |
| Carter Bobby Ray | $63,500 | -- |
Source: Public Records
Mortgage History
| Date | Status | Borrower | Loan Amount |
|---|---|---|---|
| Open | Williams Marquis | $110,000 | |
| Previous Owner | Golden Joseph Christopher | $111,000 |
Source: Public Records
Tax History Compared to Growth
Tax History
| Year | Tax Paid | Tax Assessment Tax Assessment Total Assessment is a certain percentage of the fair market value that is determined by local assessors to be the total taxable value of land and additions on the property. | Land | Improvement |
|---|---|---|---|---|
| 2024 | -- | $73,692 | $5,880 | $67,812 |
| 2023 | $0 | $74,699 | $6,586 | $68,113 |
| 2022 | $2,157 | $74,699 | $6,586 | $68,113 |
| 2021 | $1,843 | $58,771 | $6,586 | $52,185 |
| 2020 | $1,807 | $56,980 | $6,586 | $50,394 |
| 2019 | $1,463 | $45,252 | $6,586 | $38,666 |
| 2018 | $1,423 | $43,600 | $6,586 | $37,014 |
| 2017 | $1,299 | $41,837 | $6,586 | $35,251 |
| 2016 | $1,299 | $41,837 | $6,586 | $35,251 |
| 2015 | $1,311 | $41,837 | $6,586 | $35,251 |
| 2014 | $1,309 | $41,838 | $6,586 | $35,251 |
| 2013 | -- | $41,837 | $6,586 | $35,251 |
Source: Public Records
Map
Nearby Homes