2509 E Main St Medford, OR 97504
Estimated Value: $432,000 - $508,000
3
Beds
2
Baths
1,742
Sq Ft
$269/Sq Ft
Est. Value
About This Home
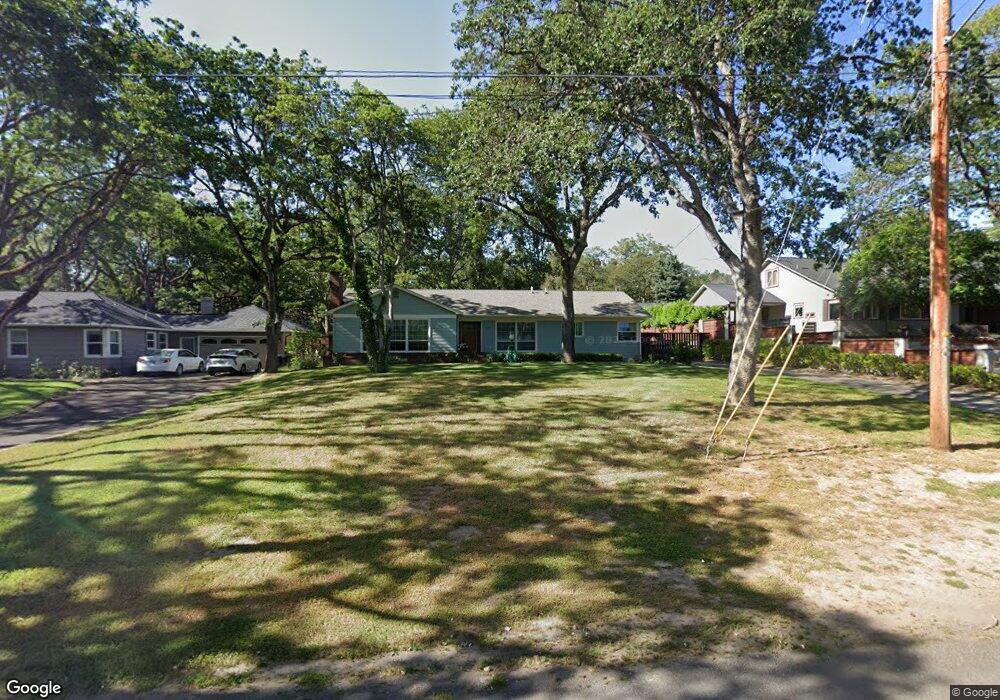
This home is located at 2509 E Main St, Medford, OR 97504 and is currently estimated at $468,113, approximately $268 per square foot. 2509 E Main St is a home located in Jackson County with nearby schools including Hoover Elementary School, Hedrick Middle School, and South Medford High School.
Ownership History
Date
Name
Owned For
Owner Type
Purchase Details
Closed on
Mar 5, 2012
Sold by
Bevard Linda M
Bought by
Christensen Lynda J
Current Estimated Value
Home Financials for this Owner
Home Financials are based on the most recent Mortgage that was taken out on this home.
Original Mortgage
$190,056
Outstanding Balance
$130,555
Interest Rate
3.87%
Mortgage Type
FHA
Estimated Equity
$337,558
Purchase Details
Closed on
Dec 21, 2011
Sold by
Alexander Genevieve
Bought by
Bevard Linda M
Create a Home Valuation Report for This Property
The Home Valuation Report is an in-depth analysis detailing your home's value as well as a comparison with similar homes in the area
Home Values in the Area
Average Home Value in this Area
Purchase History
| Date | Buyer | Sale Price | Title Company |
|---|---|---|---|
| Christensen Lynda J | $195,000 | First American | |
| Bevard Linda M | $140,000 | Amerititle |
Source: Public Records
Mortgage History
| Date | Status | Borrower | Loan Amount |
|---|---|---|---|
| Open | Christensen Lynda J | $190,056 |
Source: Public Records
Tax History Compared to Growth
Tax History
| Year | Tax Paid | Tax Assessment Tax Assessment Total Assessment is a certain percentage of the fair market value that is determined by local assessors to be the total taxable value of land and additions on the property. | Land | Improvement |
|---|---|---|---|---|
| 2025 | $3,321 | $255,280 | $134,100 | $121,180 |
| 2024 | $3,321 | $247,850 | $130,200 | $117,650 |
| 2023 | $3,219 | $240,640 | $126,420 | $114,220 |
| 2022 | $3,141 | $240,640 | $126,420 | $114,220 |
| 2021 | $3,060 | $233,640 | $122,750 | $110,890 |
| 2020 | $2,995 | $226,840 | $119,180 | $107,660 |
| 2019 | $2,924 | $213,830 | $112,350 | $101,480 |
| 2018 | $2,849 | $207,610 | $109,090 | $98,520 |
| 2017 | $2,798 | $207,610 | $109,090 | $98,520 |
| 2016 | $2,816 | $195,700 | $102,840 | $92,860 |
| 2015 | $2,707 | $195,700 | $102,840 | $92,860 |
| 2014 | $2,659 | $184,470 | $96,940 | $87,530 |
Source: Public Records
Map
Nearby Homes
- 91 Black Oak Dr
- 164 Black Oak Dr
- 109 Kensington Square
- 101 S Modoc Ave
- 2233 Oakwood Dr
- 721 Brookdale Ave
- 325 Sutter Ave
- 2020 Ridge Way
- 305 S Groveland Ave
- 740 N Modoc Ave
- 312 N Barneburg Rd
- 2556 Dellwood Ave
- 1925 Stratford Ave
- 889 Valley View Dr
- 1711 E Main St
- 433 Highland Dr
- 1560 Cambridge Cir
- 430 Highland Dr
- 1137 Riverrock Way
- 1503 E Main St
- 2517 E Main St
- 2445 E Main St
- 2435 E Main St
- 48 Black Oak Dr
- 64 Black Oak Dr
- 2517 E Black Oak Dr
- 32 Black Oak Dr
- 2468 Hillcrest Rd
- 2460 Hillcrest Rd
- 2520 E Main St
- 2512 E Main St
- 2450 Hillcrest Rd
- 2500 E Main St
- 2431 E Main St
- 12 Black Oak Dr
- 2440 Hillcrest Rd
- 1 White Oak Dr
- 7 White Oak Dr
- 71 Black Oak Dr
- 59 Black Oak Dr