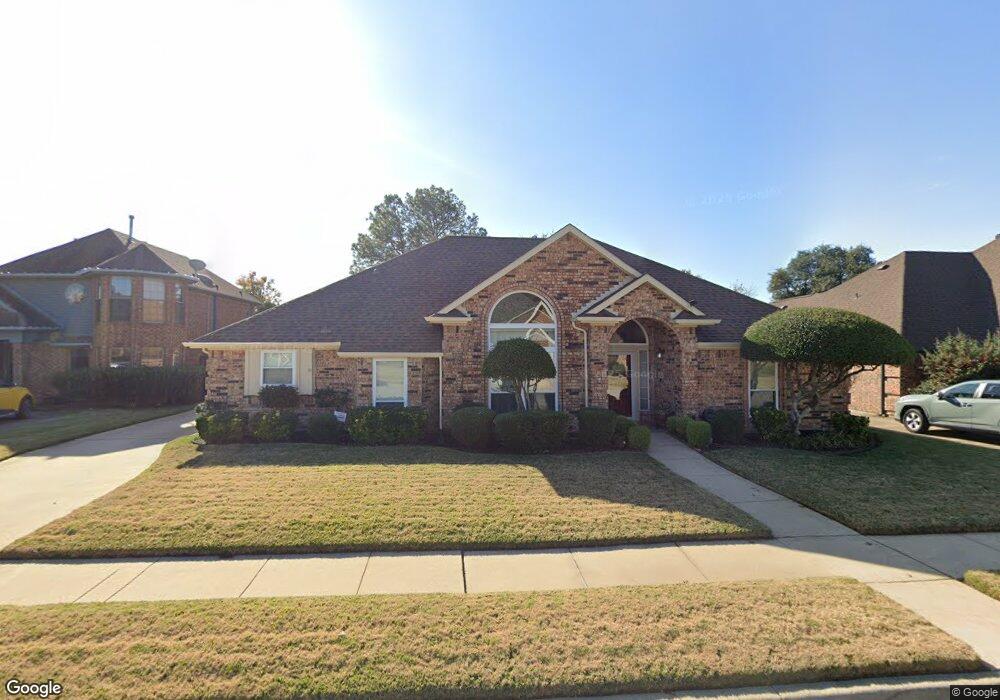
2509 Fox Glenn Cir Bedford, TX 76021
Estimated Value: $513,572 - $552,000
4
Beds
3
Baths
2,425
Sq Ft
$218/Sq Ft
Est. Value
About This Home
This home is located at 2509 Fox Glenn Cir, Bedford, TX 76021 and is currently estimated at $527,893, approximately $217 per square foot. 2509 Fox Glenn Cir is a home located in Tarrant County with nearby schools including Spring Garden Elementary School, Harwood Junior High School, and Trinity High School.
Ownership History
Date
Name
Owned For
Owner Type
Purchase Details
Closed on
Aug 3, 2010
Sold by
Patterson Edward and Patterson Juliet
Bought by
Patterson Edward A and Patterson Juliet S
Current Estimated Value
Purchase Details
Closed on
Sep 11, 1998
Sold by
Schreiber John W
Bought by
Patterson Edward A and Patterson Juliet S
Home Financials for this Owner
Home Financials are based on the most recent Mortgage that was taken out on this home.
Original Mortgage
$100,000
Outstanding Balance
$21,454
Interest Rate
6.95%
Estimated Equity
$506,439
Purchase Details
Closed on
Aug 15, 1997
Sold by
Adania Peter M and Adania Rita
Bought by
Schreiber John W
Home Financials for this Owner
Home Financials are based on the most recent Mortgage that was taken out on this home.
Original Mortgage
$156,750
Interest Rate
7.47%
Create a Home Valuation Report for This Property
The Home Valuation Report is an in-depth analysis detailing your home's value as well as a comparison with similar homes in the area
Home Values in the Area
Average Home Value in this Area
Purchase History
| Date | Buyer | Sale Price | Title Company |
|---|---|---|---|
| Patterson Edward A | -- | None Available | |
| Patterson Edward A | -- | Commonwealth Land Title | |
| Schreiber John W | -- | Ticor Land Title Co |
Source: Public Records
Mortgage History
| Date | Status | Borrower | Loan Amount |
|---|---|---|---|
| Open | Patterson Edward A | $100,000 | |
| Previous Owner | Schreiber John W | $156,750 |
Source: Public Records
Tax History Compared to Growth
Tax History
| Year | Tax Paid | Tax Assessment Tax Assessment Total Assessment is a certain percentage of the fair market value that is determined by local assessors to be the total taxable value of land and additions on the property. | Land | Improvement |
|---|---|---|---|---|
| 2025 | $1,831 | $436,728 | $100,000 | $336,728 |
| 2024 | $1,831 | $485,253 | $100,000 | $385,253 |
| 2023 | $8,182 | $450,000 | $65,000 | $385,000 |
| 2022 | $8,470 | $428,278 | $65,000 | $363,278 |
| 2021 | $8,304 | $356,480 | $65,000 | $291,480 |
| 2020 | $7,620 | $320,489 | $65,000 | $255,489 |
| 2019 | $7,912 | $338,804 | $65,000 | $273,804 |
| 2018 | $3,393 | $296,064 | $65,000 | $231,064 |
| 2017 | $6,511 | $287,666 | $30,000 | $257,666 |
| 2016 | $5,919 | $244,681 | $30,000 | $214,681 |
| 2015 | $3,385 | $229,564 | $30,000 | $199,564 |
| 2014 | $3,385 | $229,564 | $30,000 | $199,564 |
Source: Public Records
Map
Nearby Homes
- 3721 Fieldcrest Ln
- 3152 Woodbridge Dr
- 2305 Meadowlark Ln
- 2209 Laurel Ct
- 3840 Edgewater Dr
- 2609 Talisman Ct
- Seaberry II Plan at Grace Park - Signature Series
- Primrose FE V Plan at Grace Park - Signature Series
- Hawthorne Plan at Grace Park - Signature Series
- Seaberry Plan at Grace Park - Signature Series
- Gardenia Plan at Grace Park - Signature Series
- Bellflower IV Plan at Grace Park - Signature Series
- Bellflower II Plan at Grace Park - Signature Series
- Carolina IV Plan at Grace Park - Signature Series
- Carolina Plan at Grace Park - Signature Series
- Violet III Plan at Grace Park - Signature Series
- Violet IV Plan at Grace Park - Signature Series
- Magnolia III Plan at Grace Park - Signature Series
- Violet II Plan at Grace Park - Signature Series
- Rose II Plan at Grace Park - Signature Series
- 2505 Fox Glenn Cir
- 2513 Fox Glenn Cir
- 2337 Fox Glenn Cir
- 2517 Fox Glenn Cir
- 2501 Fox Glenn Cir
- 2333 Fox Glenn Cir
- 2341 Fox Glenn Cir
- 2508 Fox Glenn Cir
- 2401 Fox Glenn Cir
- 2329 Fox Glenn Cir
- 2504 Fox Glenn Cir
- 2512 Fox Glenn Cir
- 2521 Fox Glenn Cir
- 2516 Fox Glenn Cir
- 2500 Fox Glenn Cir
- 2325 Fox Glenn Cir
- 2520 Fox Glenn Cir
- 2525 Fox Glenn Cir
- 2416 Fox Glenn Cir
- 2412 Fox Glenn Cir