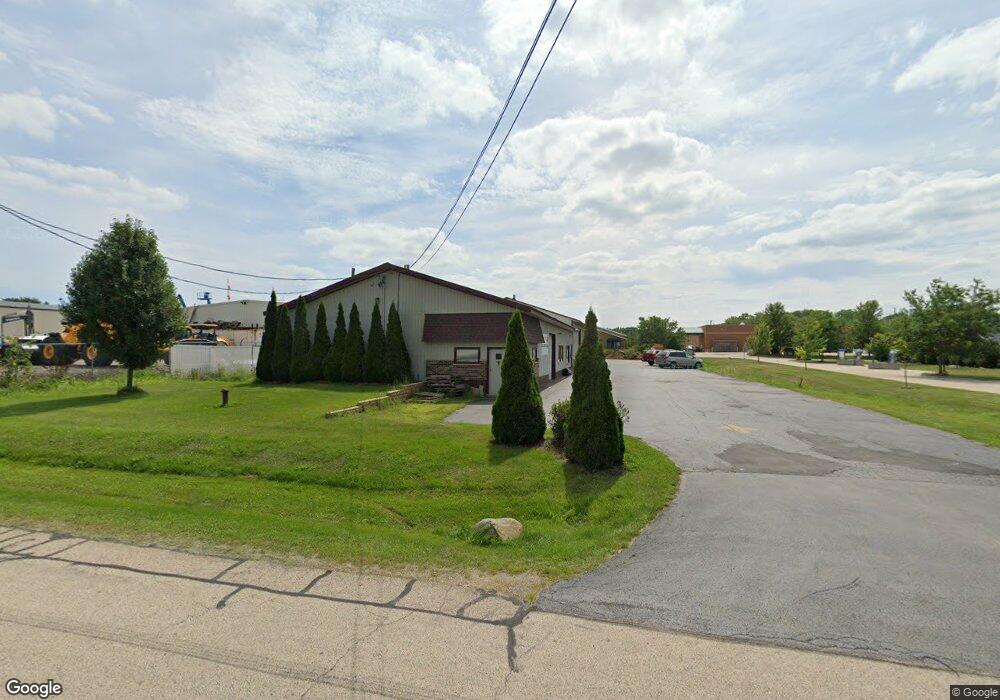
2509 Highview St Spring Grove, IL 60081
Estimated Value: $683,114
Studio
--
Bath
6,400
Sq Ft
$107/Sq Ft
Est. Value
About This Home
This home is located at 2509 Highview St, Spring Grove, IL 60081 and is currently estimated at $683,114, approximately $106 per square foot. 2509 Highview St is a home located in McHenry County with nearby schools including Spring Grove Elementary School, Nippersink Middle School, and Richmond-Burton High School.
Ownership History
Date
Name
Owned For
Owner Type
Purchase Details
Closed on
Aug 16, 2017
Sold by
Chicago Title Land Trust
Bought by
Mkhco Llc
Current Estimated Value
Home Financials for this Owner
Home Financials are based on the most recent Mortgage that was taken out on this home.
Original Mortgage
$960,000
Interest Rate
4.03%
Mortgage Type
Commercial
Purchase Details
Closed on
Aug 19, 2011
Sold by
Ferrero & Vancrey Llc
Bought by
Chicago Land Trust Company and Trust #122543
Home Financials for this Owner
Home Financials are based on the most recent Mortgage that was taken out on this home.
Original Mortgage
$250,000
Interest Rate
5.5%
Mortgage Type
Commercial
Purchase Details
Closed on
Feb 21, 2007
Sold by
Warner Resurfacing Inc
Bought by
Ferrero & Vancrey Llc
Create a Home Valuation Report for This Property
The Home Valuation Report is an in-depth analysis detailing your home's value as well as a comparison with similar homes in the area
Home Values in the Area
Average Home Value in this Area
Purchase History
| Date | Buyer | Sale Price | Title Company |
|---|---|---|---|
| Mkhco Llc | $400,000 | Chicago Title | |
| Chicago Land Trust Company | $335,000 | Chicago Title | |
| Ferrero & Vancrey Llc | $400,000 | Chicago Title |
Source: Public Records
Mortgage History
| Date | Status | Borrower | Loan Amount |
|---|---|---|---|
| Closed | Mkhco Llc | $960,000 | |
| Previous Owner | Chicago Land Trust Company | $250,000 |
Source: Public Records
Tax History
| Year | Tax Paid | Tax Assessment Tax Assessment Total Assessment is a certain percentage of the fair market value that is determined by local assessors to be the total taxable value of land and additions on the property. | Land | Improvement |
|---|---|---|---|---|
| 2024 | $12,738 | $166,550 | $15,981 | $150,569 |
| 2023 | $12,452 | $152,253 | $14,609 | $137,644 |
| 2022 | $11,874 | $137,091 | $13,154 | $123,937 |
| 2021 | $12,219 | $131,578 | $12,625 | $118,953 |
| 2020 | $12,777 | $126,603 | $12,148 | $114,455 |
| 2019 | $11,263 | $122,535 | $11,758 | $110,777 |
| 2018 | $8,575 | $83,325 | $11,272 | $72,053 |
| 2017 | $8,151 | $71,439 | $11,272 | $60,167 |
| 2016 | $7,223 | $66,978 | $10,568 | $56,410 |
| 2013 | -- | $73,030 | $9,992 | $63,038 |
Source: Public Records
Map
Nearby Homes
- 2150 U S 12
- 7416 Briar Ct
- 7404 Briar Ct
- 2617 Spring Leaf Dr
- 3012 Rolling Oaks Rd
- 2910 Rolling Oaks Rd
- 3006 Rolling Oaks Rd
- 2214 Main Street Rd
- 3013 N US Highway 12
- 1992 Red Oak Ln
- 2003 Red Oak Ln
- 7213 Briar Dr
- 2912 Briar Dr
- 7377 English Oak Ln
- 2909 Briar Dr
- 7393 English Oak Ln
- LOT 9 Mayo Ct
- 7381 English Oak Ln
- 1876 Red Oak Ln
- 7373 English Oak Ln
- 2504 Westward Dr
- 2510 U S 12
- 7800 Winn Rd
- 2440 Highview St Unit E
- 2440 Westward Dr Unit B
- 2440 Westward Dr Unit A
- 2440 Westward Dr Unit D
- 2414 Highview St
- 2450 U S 12
- 2418 Highview St
- 1615 U S 12
- LOT 3013 U S 12
- 2215 U S 12
- 3.6 acres U S 12
- Lot 4 U S 12
- 2450 N US Highway 12 Unit O
- 2450 N US Highway 12
- 2450 N US Highway 12 Unit E
- 2450 N US Highway 12 Unit N
- 2450 N US Highway 12 Unit OP
Your Personal Tour Guide
Ask me questions while you tour the home.