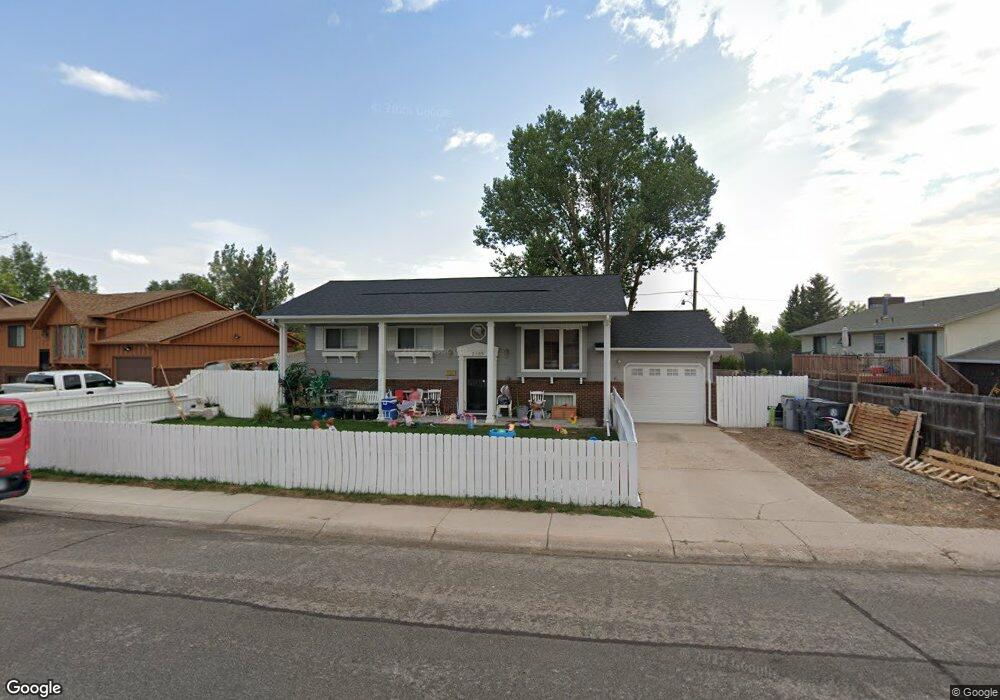
2509 Maple Way Cheyenne, WY 82009
Estimated Value: $350,000 - $409,000
4
Beds
3
Baths
1,066
Sq Ft
$352/Sq Ft
Est. Value
About This Home
This home is located at 2509 Maple Way, Cheyenne, WY 82009 and is currently estimated at $374,759, approximately $351 per square foot. 2509 Maple Way is a home located in Laramie County with nearby schools including Buffalo Ridge Elementary School, Carey Junior High School, and East High School.
Ownership History
Date
Name
Owned For
Owner Type
Purchase Details
Closed on
Jun 28, 2005
Sold by
Ackerman Ryan Wayne and Ackerman Tara Lea
Bought by
Venable Orlando A
Current Estimated Value
Home Financials for this Owner
Home Financials are based on the most recent Mortgage that was taken out on this home.
Original Mortgage
$145,600
Outstanding Balance
$76,054
Interest Rate
5.67%
Mortgage Type
Fannie Mae Freddie Mac
Estimated Equity
$298,705
Purchase Details
Closed on
Sep 24, 1999
Sold by
Mitchell David C and Mitchell Jean M
Bought by
Ackerman Ryan Wayne and Ackerman Tara Lea
Home Financials for this Owner
Home Financials are based on the most recent Mortgage that was taken out on this home.
Original Mortgage
$113,050
Interest Rate
8.18%
Purchase Details
Closed on
Dec 28, 1998
Sold by
Allen Scott and Allen Karen
Bought by
Mitchell David C and Mitchell Jean M
Home Financials for this Owner
Home Financials are based on the most recent Mortgage that was taken out on this home.
Original Mortgage
$109,250
Interest Rate
6.92%
Create a Home Valuation Report for This Property
The Home Valuation Report is an in-depth analysis detailing your home's value as well as a comparison with similar homes in the area
Home Values in the Area
Average Home Value in this Area
Purchase History
| Date | Buyer | Sale Price | Title Company |
|---|---|---|---|
| Venable Orlando A | -- | -- | |
| Ackerman Ryan Wayne | -- | -- | |
| Mitchell David C | -- | -- |
Source: Public Records
Mortgage History
| Date | Status | Borrower | Loan Amount |
|---|---|---|---|
| Open | Venable Orlando A | $145,600 | |
| Previous Owner | Ackerman Ryan Wayne | $113,050 | |
| Previous Owner | Mitchell David C | $109,250 |
Source: Public Records
Tax History Compared to Growth
Tax History
| Year | Tax Paid | Tax Assessment Tax Assessment Total Assessment is a certain percentage of the fair market value that is determined by local assessors to be the total taxable value of land and additions on the property. | Land | Improvement |
|---|---|---|---|---|
| 2025 | $2,380 | $26,126 | $3,171 | $22,955 |
| 2024 | $2,380 | $33,657 | $4,228 | $29,429 |
| 2023 | $2,361 | $33,391 | $4,228 | $29,163 |
| 2022 | $2,224 | $30,811 | $4,228 | $26,583 |
| 2021 | $1,978 | $27,342 | $4,228 | $23,114 |
| 2020 | $1,785 | $24,750 | $4,228 | $20,522 |
| 2019 | $1,676 | $23,214 | $4,228 | $18,986 |
| 2018 | $1,585 | $22,156 | $3,176 | $18,980 |
| 2017 | $1,506 | $20,871 | $3,176 | $17,695 |
| 2016 | $1,430 | $19,800 | $3,012 | $16,788 |
| 2015 | $1,334 | $18,473 | $3,012 | $15,461 |
| 2014 | $1,331 | $18,311 | $3,012 | $15,299 |
Source: Public Records
Map
Nearby Homes
- 5125 Maple Way
- 2507 Pattison Ave Unit 1-4
- 4745 Windmill Rd
- 4940 Mountain Rd
- 4729 Cactus Way
- 5402 Hilltop Ave
- 5502 Canyon Rd
- 100 Clover Ct
- 3117 Douglas St
- 4700 King Arthur Way
- 2544 Levi Rd
- 5120 Bowie Dr
- 5702 Mica Bluff
- 5801 Mica Bluff
- 2113 Pattison Ave
- 3315 Dean Paul Dr
- 5208 Danielle Ct
- 4816 Ridge Rd
- 3320 Thomas Rd
- 4744 Piccadilly Dr
- 2517 Maple Way
- 5213 Windmill Rd
- 2508 Linden Way
- 2514 Linden Way
- 2525 Maple Way
- 2508 Maple Way
- 2514 Maple Way
- 2520 Maple Way
- 2520 Linden Way
- 5324 Maple Way
- 5216 Windmill Rd
- 5210 Windmill Rd
- 5302 Windmill Rd
- 2524 Maple Way
- 2436 Melton St
- 2511 Linden Way
- 2511 Windmill Rd
- 5315 Windmill Rd
- 5308 Windmill Rd
- 2503 Linden Way