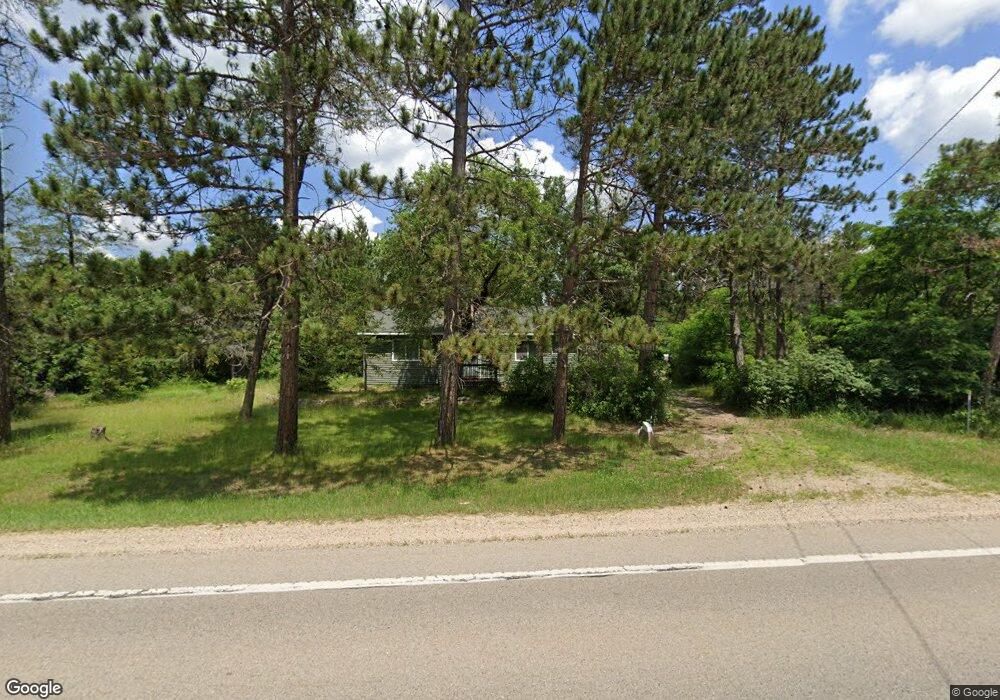
2509 N M 18 Roscommon, MI 48653
Estimated Value: $203,000 - $259,000
--
Bed
--
Bath
1,430
Sq Ft
$158/Sq Ft
Est. Value
About This Home
This home is located at 2509 N M 18, Roscommon, MI 48653 and is currently estimated at $225,920, approximately $157 per square foot. 2509 N M 18 is a home located in Crawford County with nearby schools including Roscommon Elementary School, Roscommon Middle School, and Roscommon High School.
Ownership History
Date
Name
Owned For
Owner Type
Purchase Details
Closed on
Feb 5, 2009
Sold by
Abbott Danny R
Bought by
Abbott Danny
Current Estimated Value
Purchase Details
Closed on
Dec 25, 2008
Sold by
Abbott Danny R
Bought by
Abbott Danny R
Purchase Details
Closed on
Oct 2, 2006
Sold by
Workman Ira
Bought by
Abbott Danny R
Purchase Details
Closed on
Aug 5, 2002
Sold by
Workman Maryilyn
Bought by
Workman Ira
Purchase Details
Closed on
Aug 2, 2002
Sold by
Workman Maryilyn
Bought by
Workman Ira
Purchase Details
Closed on
Apr 5, 1997
Sold by
Brennan Joseph P
Bought by
Workman Marylin
Purchase Details
Closed on
Mar 29, 1997
Sold by
Ross Clara H
Bought by
Brennan Joseph P
Purchase Details
Closed on
Mar 3, 1992
Bought by
Brennan
Purchase Details
Closed on
Aug 27, 1991
Bought by
Ross
Purchase Details
Closed on
Jul 1, 1989
Bought by
Hearn
Create a Home Valuation Report for This Property
The Home Valuation Report is an in-depth analysis detailing your home's value as well as a comparison with similar homes in the area
Home Values in the Area
Average Home Value in this Area
Purchase History
| Date | Buyer | Sale Price | Title Company |
|---|---|---|---|
| Abbott Danny | -- | -- | |
| Abbott Danny R | -- | -- | |
| Abbott Danny R | -- | -- | |
| Abbott Danny R | $26,000 | -- | |
| Workman Ira | -- | -- | |
| Workman Ira | -- | -- | |
| Workman Marylin | $11,000 | -- | |
| Brennan Joseph P | -- | -- | |
| Brennan | $7,000 | -- | |
| Ross | -- | -- | |
| Hearn | $11,500 | -- |
Source: Public Records
Tax History Compared to Growth
Tax History
| Year | Tax Paid | Tax Assessment Tax Assessment Total Assessment is a certain percentage of the fair market value that is determined by local assessors to be the total taxable value of land and additions on the property. | Land | Improvement |
|---|---|---|---|---|
| 2025 | $2,675 | $111,800 | $4,700 | $107,100 |
| 2024 | $636 | $106,600 | $4,700 | $101,900 |
| 2023 | $609 | $91,400 | $4,700 | $86,700 |
| 2022 | $580 | $72,900 | $4,700 | $68,200 |
| 2021 | $2,315 | $67,500 | $4,700 | $62,800 |
| 2020 | $2,261 | $68,100 | $4,700 | $63,400 |
| 2019 | $2,205 | $62,000 | $4,700 | $57,300 |
| 2018 | $2,165 | $52,800 | $4,700 | $48,100 |
| 2017 | $524 | $51,700 | $4,700 | $47,000 |
| 2016 | $519 | $53,100 | $4,700 | $48,400 |
| 2015 | -- | $53,100 | $0 | $0 |
| 2014 | -- | $54,500 | $0 | $0 |
| 2013 | -- | $43,700 | $0 | $0 |
Source: Public Records
Map
Nearby Homes
- Lot # 21 W Roberta Dr
- LOT #42 E Roberta Dr
- 2948 E Michigan Hwy
- 2582 E Pioneer Rd
- 11491 Pines Trail
- 10957 Pines Trail
- 1362 Esther Ct
- 38 S Eugene Dr
- 10681 Pines Trail
- V/L Steckert Bridge Rd
- 11282 Steckert Bridge Rd
- 305 S Main St
- 0 N Main St Unit 20251028047
- 10118 Curwood Trail
- 11269 Tanglewood Dr
- V/L 1.22AC N 4th St
- 0 Walker Dr Unit 50184928
- 239 Ausable River Trail
- Apache Trail
- N Everett Rd
- 2525 N M 18
- 2525 N M-18
- 2469 N M 18
- 2469 N M-18
- 2565 N M 18
- 2539 N M 18
- 2509 N M-18
- 11902 W Roberta Dr
- 11878 W Roberta Dr
- 11924 W Roberta Dr
- 2415 N M-18
- 2415 E Michigan Hwy
- 2415 N M 18
- xx Roberta
- Lot 26 W Roberta Dr
- Lot 27 W Roberta Dr
- Lot 21 W Roberta Dr
- 11808 W Roberta Dr
- XXX W Roberta Dr
- 11788 W Roberta Dr