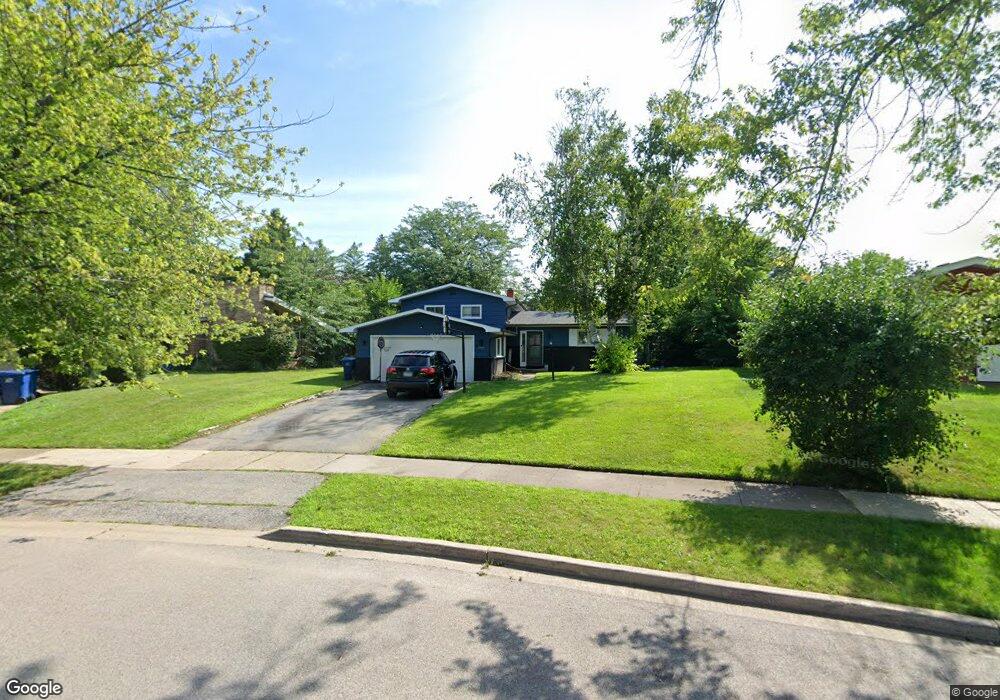
2509 Roberts Ave Waukegan, IL 60087
Estimated Value: $263,000 - $324,000
3
Beds
2
Baths
1,101
Sq Ft
$260/Sq Ft
Est. Value
About This Home
This home is located at 2509 Roberts Ave, Waukegan, IL 60087 and is currently estimated at $286,190, approximately $259 per square foot. 2509 Roberts Ave is a home located in Lake County with nearby schools including Oakdale Elementary School, Jack Benny Middle School, and Waukegan High School.
Ownership History
Date
Name
Owned For
Owner Type
Purchase Details
Closed on
Jun 9, 2017
Sold by
Fannie Mae
Bought by
Colin Jose A and Hernandez Gladys V
Current Estimated Value
Home Financials for this Owner
Home Financials are based on the most recent Mortgage that was taken out on this home.
Original Mortgage
$138,446
Outstanding Balance
$115,977
Interest Rate
4.37%
Mortgage Type
FHA
Estimated Equity
$170,213
Purchase Details
Closed on
Sep 6, 2016
Sold by
Martin Dain
Bought by
Federal National Mortgage Association and Fannie Mae
Purchase Details
Closed on
Aug 22, 2006
Sold by
Moehle John S
Bought by
Martin Dain
Home Financials for this Owner
Home Financials are based on the most recent Mortgage that was taken out on this home.
Original Mortgage
$182,000
Interest Rate
6.59%
Mortgage Type
Purchase Money Mortgage
Purchase Details
Closed on
Aug 28, 1995
Sold by
Japuntich John S and Japuntich Barbara E
Bought by
Moehle John S and Moehle Diane D
Create a Home Valuation Report for This Property
The Home Valuation Report is an in-depth analysis detailing your home's value as well as a comparison with similar homes in the area
Home Values in the Area
Average Home Value in this Area
Purchase History
| Date | Buyer | Sale Price | Title Company |
|---|---|---|---|
| Colin Jose A | $141,000 | None Available | |
| Federal National Mortgage Association | -- | Attorney | |
| Martin Dain | $182,000 | Attorneys Title Guaranty Fun | |
| Moehle John S | $132,500 | -- |
Source: Public Records
Mortgage History
| Date | Status | Borrower | Loan Amount |
|---|---|---|---|
| Open | Colin Jose A | $138,446 | |
| Previous Owner | Martin Dain | $182,000 |
Source: Public Records
Tax History Compared to Growth
Tax History
| Year | Tax Paid | Tax Assessment Tax Assessment Total Assessment is a certain percentage of the fair market value that is determined by local assessors to be the total taxable value of land and additions on the property. | Land | Improvement |
|---|---|---|---|---|
| 2024 | $6,243 | $82,388 | $14,114 | $68,274 |
| 2023 | $6,243 | $74,210 | $12,636 | $61,574 |
| 2022 | $5,059 | $57,747 | $13,997 | $43,750 |
| 2021 | $5,342 | $57,243 | $13,875 | $43,368 |
| 2020 | $5,365 | $53,328 | $12,926 | $40,402 |
| 2019 | $5,618 | $51,045 | $11,845 | $39,200 |
| 2018 | $6,328 | $52,024 | $15,320 | $36,704 |
| 2017 | $6,547 | $46,027 | $13,554 | $32,473 |
| 2016 | $0 | $37,032 | $10,905 | $26,127 |
| 2015 | $0 | $33,144 | $9,760 | $23,384 |
| 2014 | $2,954 | $28,449 | $7,279 | $21,170 |
| 2012 | $4,240 | $30,821 | $7,886 | $22,935 |
Source: Public Records
Map
Nearby Homes
- 2708 Dana Ave
- 2705 Dana Ave
- 2713 Varonen Ave
- 12312 W Audrey Ave
- 2350 N Lewis Ave
- 2613 N Lewis Ave
- 3032 W Vermont Ave
- 36955 N Garrick Ave
- 3320 Sunset Ave
- 1913 Chippewa Rd
- 2928 W Country Club Ave
- 3000 W Country Club Ave
- 2946 W Country Club Ave
- 3101 Country Club Ln
- 2440 W Cheyenne Rd
- 1612 Whitney St
- 36245 N Green Bay Rd
- 2715 W Greenwood Ave
- 1636 Rice St
- 2207 Williamsburg Dr
- 2505 Roberts Ave
- 2600 Brnot Ave
- 2501 Roberts Ave
- 2604 Brnot Ave
- 2435 Roberts Ave
- 2613 Brnot Ave
- 2608 Brnot Ave
- 2516 N Mcaree Rd
- 2500 Roberts Ave
- 2600 Dana Ave
- 2612 Brnot Ave
- 2430 Roberts Ave
- 2607 Jacquelyn Ln
- 2520 N Mcaree Rd
- 2611 Jacquelyn Ln
- 2617 Brnot Ave
- 2616 Brnot Ave
- 2612 Dana Ave
- 2615 Jacquelyn Ln
- 2511 N Mcaree Rd