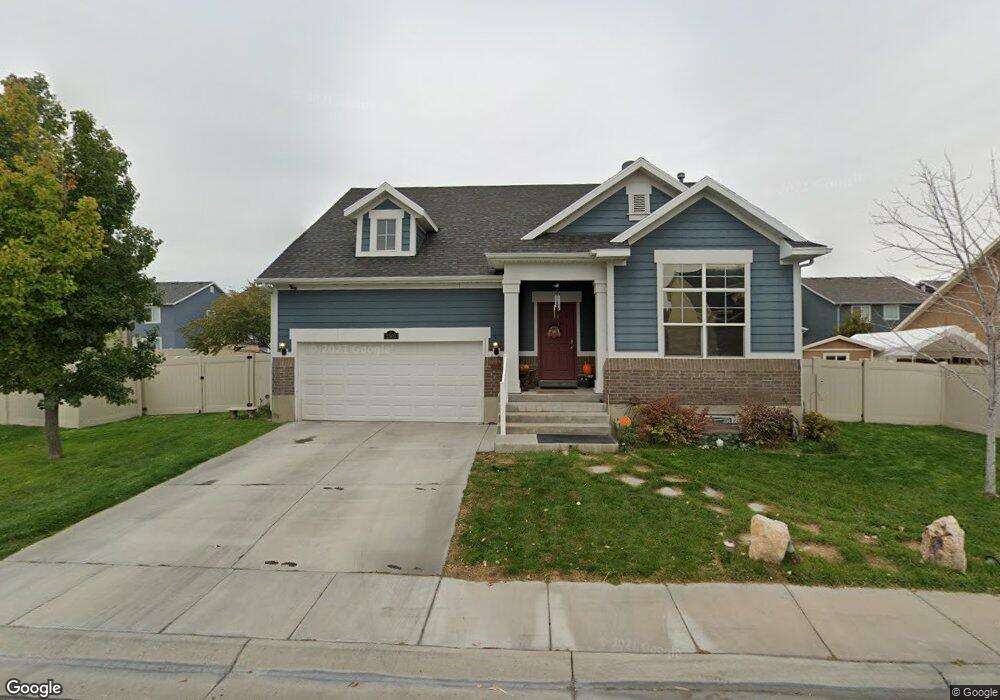
2509 S Laurel St West Haven, UT 84401
Estimated Value: $410,000 - $507,682
2
Beds
2
Baths
2,662
Sq Ft
$172/Sq Ft
Est. Value
About This Home
This home is located at 2509 S Laurel St, West Haven, UT 84401 and is currently estimated at $458,171, approximately $172 per square foot. 2509 S Laurel St is a home located in Weber County with nearby schools including Kanesville Elementary School, Rocky Mountain Junior High School, and Fremont High School.
Ownership History
Date
Name
Owned For
Owner Type
Purchase Details
Closed on
Mar 1, 2021
Sold by
Barney Karen K
Bought by
Barney Karen K
Current Estimated Value
Home Financials for this Owner
Home Financials are based on the most recent Mortgage that was taken out on this home.
Original Mortgage
$136,000
Outstanding Balance
$100,805
Interest Rate
2.7%
Mortgage Type
New Conventional
Estimated Equity
$357,366
Purchase Details
Closed on
May 5, 2010
Sold by
Destination Homes Inc
Bought by
Barney John H and Barney Karen K
Home Financials for this Owner
Home Financials are based on the most recent Mortgage that was taken out on this home.
Original Mortgage
$163,920
Interest Rate
4.94%
Mortgage Type
New Conventional
Purchase Details
Closed on
Jan 8, 2010
Sold by
West Haven Holdings Llc
Bought by
Destination Homes Inc
Home Financials for this Owner
Home Financials are based on the most recent Mortgage that was taken out on this home.
Original Mortgage
$144,778
Interest Rate
18%
Mortgage Type
Purchase Money Mortgage
Create a Home Valuation Report for This Property
The Home Valuation Report is an in-depth analysis detailing your home's value as well as a comparison with similar homes in the area
Home Values in the Area
Average Home Value in this Area
Purchase History
| Date | Buyer | Sale Price | Title Company |
|---|---|---|---|
| Barney Karen K | -- | Titleone | |
| Barney John H | -- | Bonneville Superior Title Co | |
| Destination Homes Inc | -- | Bonneville Superior Title Co |
Source: Public Records
Mortgage History
| Date | Status | Borrower | Loan Amount |
|---|---|---|---|
| Open | Barney Karen K | $136,000 | |
| Closed | Barney John H | $163,920 | |
| Previous Owner | Destination Homes Inc | $144,778 |
Source: Public Records
Tax History Compared to Growth
Tax History
| Year | Tax Paid | Tax Assessment Tax Assessment Total Assessment is a certain percentage of the fair market value that is determined by local assessors to be the total taxable value of land and additions on the property. | Land | Improvement |
|---|---|---|---|---|
| 2025 | $2,660 | $479,164 | $144,457 | $334,707 |
| 2024 | $2,566 | $259,049 | $79,451 | $179,598 |
| 2023 | $2,491 | $249,150 | $79,262 | $169,888 |
| 2022 | $2,404 | $245,850 | $79,262 | $166,588 |
| 2021 | $2,013 | $349,000 | $83,819 | $265,181 |
| 2020 | $1,961 | $312,000 | $73,654 | $238,346 |
| 2019 | $1,868 | $281,000 | $58,204 | $222,796 |
| 2018 | $1,791 | $258,000 | $58,204 | $199,796 |
| 2017 | $1,842 | $258,000 | $53,396 | $204,604 |
| 2016 | $1,871 | $141,803 | $23,824 | $117,979 |
| 2015 | $1,896 | $141,803 | $23,824 | $117,979 |
| 2014 | $1,743 | $127,314 | $23,824 | $103,490 |
Source: Public Records
Map
Nearby Homes
- 2455 Gilmour St
- 2488 S Andover St
- 2448 S Andover St Unit 333
- 2444 S Andover St Unit 331
- 2307 W 2525 S
- 2496 S 2355 W
- 2664 S 2250 St W Unit 202
- 2667 S 2300 St W Unit 255
- 2274 W 2710 S Unit 273
- 2274 W 2710 S Unit 271
- 3417 2730 S Unit 2
- 2901 S 1900 W
- 3045 S 2275 St W
- 1781 S 1900 W
- 3154 W 3125 S Unit 18
- 3165 W 3125 S Unit 15
- 3153 W 3125 S Unit 17
- 3159 W 3125 S Unit 16
- 3171 W 3125 S Unit 14
- 3177 W 3125 S Unit 13
- 2499 S Laurel St
- 2499 S Laurel St
- 2499 S Laurel St Unit 201
- 2519 S Laurel St
- 2514 S 2200 W Unit 6
- 2502 S 2200 W
- 2512 S Laurel St
- 2518 S 2200 W Unit 5
- 2512 S Laurel St
- 2504 S Laurel St Unit 226
- 2504 S Laurel St
- 2504 S Laurel St
- 2498 S 2200 W
- 2518 S Laurel St
- 2518 S Laurel St
- 2498 S Laurel St
- 2498 S Laurel St
- 2490 S 2200 W Unit 201
- 2524 S 2200 W Unit 4
- 2498 S Laurel St