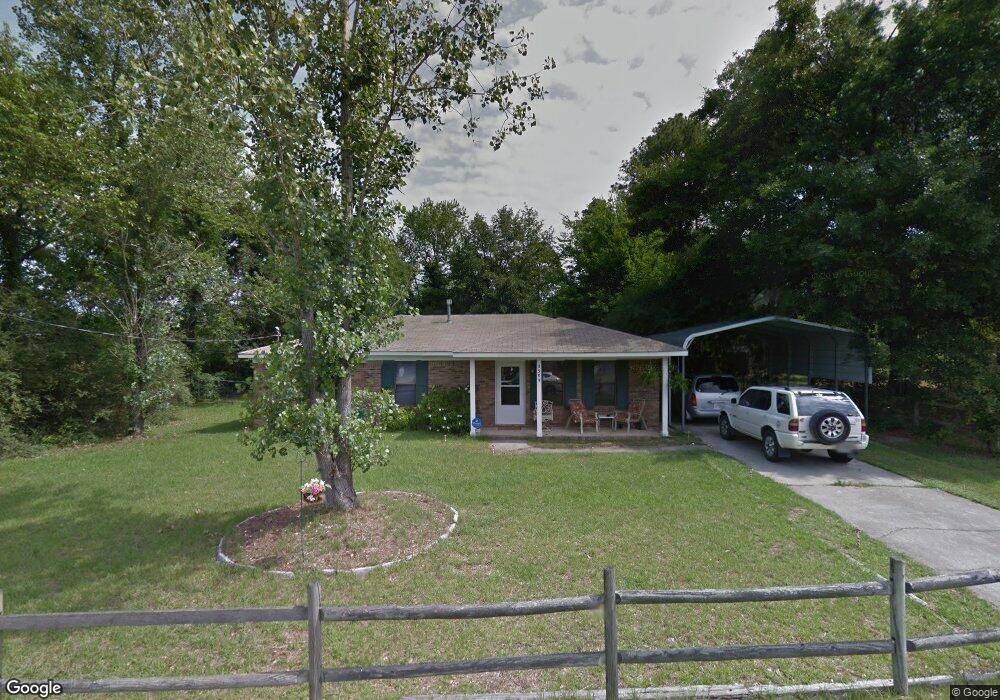
2509S Fieldcrest Dr S Hephzibah, GA 30815
Jamestown NeighborhoodEstimated Value: $156,000 - $190,000
3
Beds
1
Bath
1,215
Sq Ft
$138/Sq Ft
Est. Value
About This Home
This home is located at 2509S Fieldcrest Dr S, Hephzibah, GA 30815 and is currently estimated at $167,184, approximately $137 per square foot. 2509S Fieldcrest Dr S is a home located in Richmond County with nearby schools including Diamond Lakes Elementary School, Pine Hill Middle School, and Johnson Magnet.
Ownership History
Date
Name
Owned For
Owner Type
Purchase Details
Closed on
Sep 5, 2017
Sold by
Teel Diane Sewell
Bought by
Teel Joseph Elmer
Current Estimated Value
Purchase Details
Closed on
Mar 28, 2000
Sold by
Garrett Michael
Bought by
Teel Dianne S
Home Financials for this Owner
Home Financials are based on the most recent Mortgage that was taken out on this home.
Original Mortgage
$49,591
Interest Rate
8.28%
Mortgage Type
FHA
Purchase Details
Closed on
Sep 1, 1992
Sold by
Thompson Charles
Bought by
Garrett Michael
Purchase Details
Closed on
Aug 31, 1992
Sold by
Thompson Charles
Bought by
Garrett Michael
Purchase Details
Closed on
Feb 12, 1988
Sold by
Veterans Affairs Administrator Of The
Bought by
Thompson Charles
Purchase Details
Closed on
Feb 1, 1988
Sold by
Veterans Affairs Ad
Bought by
Thompson Charles
Purchase Details
Closed on
Dec 1, 1986
Sold by
Barnett Maurice E
Bought by
Johnson Cecil
Create a Home Valuation Report for This Property
The Home Valuation Report is an in-depth analysis detailing your home's value as well as a comparison with similar homes in the area
Home Values in the Area
Average Home Value in this Area
Purchase History
| Date | Buyer | Sale Price | Title Company |
|---|---|---|---|
| Teel Joseph Elmer | -- | -- | |
| Teel Dianne S | $50,000 | -- | |
| Garrett Michael | -- | -- | |
| Garrett Michael | $46,400 | -- | |
| Thompson Charles | -- | -- | |
| Thompson Charles | $42,000 | -- | |
| Johnson Cecil | $44,600 | -- |
Source: Public Records
Mortgage History
| Date | Status | Borrower | Loan Amount |
|---|---|---|---|
| Previous Owner | Teel Dianne S | $49,591 |
Source: Public Records
Tax History Compared to Growth
Tax History
| Year | Tax Paid | Tax Assessment Tax Assessment Total Assessment is a certain percentage of the fair market value that is determined by local assessors to be the total taxable value of land and additions on the property. | Land | Improvement |
|---|---|---|---|---|
| 2025 | $2,119 | $63,232 | $7,200 | $56,032 |
| 2024 | $2,119 | $58,056 | $7,200 | $50,856 |
| 2023 | $1,871 | $55,900 | $7,200 | $48,700 |
| 2022 | $1,370 | $37,843 | $7,200 | $30,643 |
| 2021 | $1,291 | $31,891 | $7,200 | $24,691 |
| 2020 | $1,272 | $31,891 | $7,200 | $24,691 |
| 2019 | $1,342 | $31,891 | $7,200 | $24,691 |
| 2018 | $1,351 | $31,891 | $7,200 | $24,691 |
| 2017 | $589 | $31,891 | $7,200 | $24,691 |
| 2016 | $589 | $31,891 | $7,200 | $24,691 |
| 2015 | $589 | $31,891 | $7,200 | $24,691 |
| 2014 | $580 | $31,193 | $7,200 | $23,993 |
Source: Public Records
Map
Nearby Homes
- 2348 Fieldcrest Dr S
- 4309 Windsor Spring Rd
- 2806 Wyndham Dr
- 4212 Cap Chat St
- 212 Willowton Ln
- 210 Willowton Ln
- 208 Willowton Ln
- 206 Willowton Ln
- 1018 Rosendale Dr
- 1016 Rosendale Dr
- 1012 Rosendale Dr
- 2711 Ashton Dr
- 2603 Ardwick Dr
- 2676 Ashton Dr
- 3371 Stockport Dr
- 3359 Stockport Dr
- 3351 Stockport Dr
- 3363 Stockport Dr
- 3367 Stockport Dr
- 3366 Stockport Dr
- 4235 Cap Chat St
- 2513 Fieldcrest Dr S
- 4233 Cap Chat St
- 2514 Fieldcrest Dr S
- 2509 S Fieldcrest Dr
- 4231 Cap Chat St
- 2518 S Fieldcrest Dr
- 2514S Fieldcrest Dr S
- 2510 Fieldcrest Dr S
- 2510 Fieldcrest Dr S
- 2512S Fieldcrest Dr S
- 2520 Fieldcrest Dr S
- 2505 Fieldcrest Dr S
- 4229 Cap Chat St
- 4234 Cap Chat St
- 2508 Fieldcrest Dr S
- 2508S Fieldcrest Dr S
- 4232 Cap Chat St
- 4227 Cap Chat St
- 2506 Fieldcrest Dr S