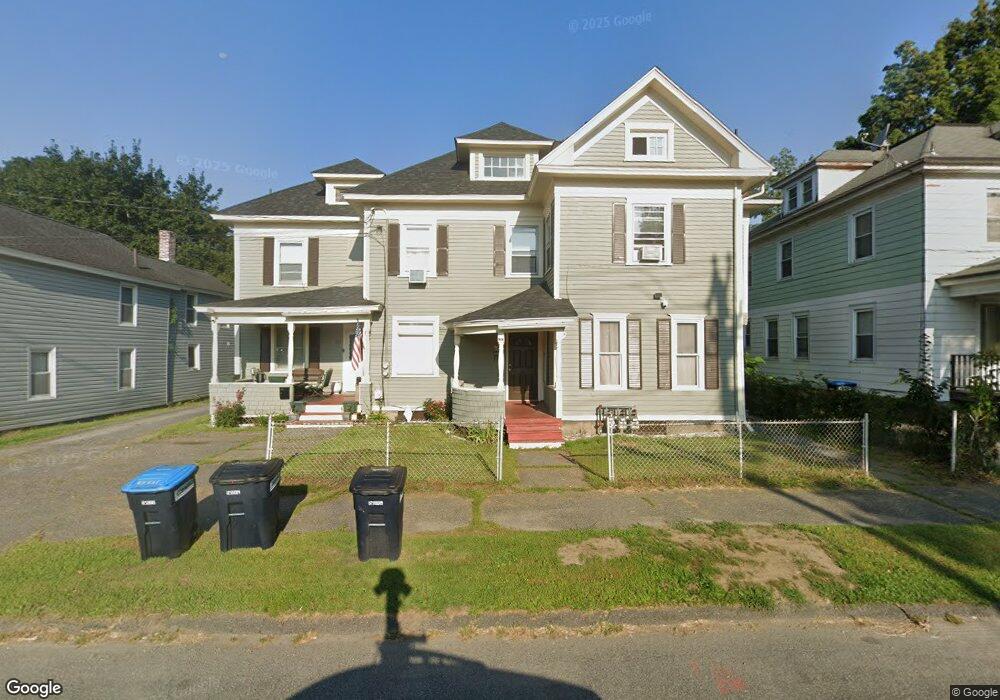
251 2nd St Pittsfield, MA 01201
Estimated Value: $285,000 - $355,479
6
Beds
3
Baths
3,058
Sq Ft
$106/Sq Ft
Est. Value
About This Home
This home is located at 251 2nd St, Pittsfield, MA 01201 and is currently estimated at $323,120, approximately $105 per square foot. 251 2nd St is a home located in Berkshire County with nearby schools including Morningside Community School, Theodore Herberg Middle School, and Pittsfield High School.
Ownership History
Date
Name
Owned For
Owner Type
Purchase Details
Closed on
Jul 18, 2023
Sold by
Thimot Marifant and Thimot Delores
Bought by
Thimot Merifant
Current Estimated Value
Home Financials for this Owner
Home Financials are based on the most recent Mortgage that was taken out on this home.
Original Mortgage
$99,000
Outstanding Balance
$96,585
Interest Rate
6.67%
Mortgage Type
Stand Alone Refi Refinance Of Original Loan
Estimated Equity
$226,535
Purchase Details
Closed on
Sep 8, 2005
Sold by
Scolforo Edward T and Scolforo Marilyn D
Bought by
Thimot Merifant and Thimot Delores
Home Financials for this Owner
Home Financials are based on the most recent Mortgage that was taken out on this home.
Original Mortgage
$103,750
Interest Rate
5.79%
Mortgage Type
Purchase Money Mortgage
Create a Home Valuation Report for This Property
The Home Valuation Report is an in-depth analysis detailing your home's value as well as a comparison with similar homes in the area
Home Values in the Area
Average Home Value in this Area
Purchase History
| Date | Buyer | Sale Price | Title Company |
|---|---|---|---|
| Thimot Merifant | -- | None Available | |
| Thimot Merifant | -- | None Available | |
| Thimot Merifant | -- | None Available | |
| Thimot Merifant | $173,750 | -- | |
| Thimot Merifant | $173,750 | -- | |
| Thimot Merifant | $173,750 | -- |
Source: Public Records
Mortgage History
| Date | Status | Borrower | Loan Amount |
|---|---|---|---|
| Open | Thimot Merifant | $99,000 | |
| Closed | Thimot Merifant | $99,000 | |
| Previous Owner | Thimot Merifant | $103,750 |
Source: Public Records
Tax History Compared to Growth
Tax History
| Year | Tax Paid | Tax Assessment Tax Assessment Total Assessment is a certain percentage of the fair market value that is determined by local assessors to be the total taxable value of land and additions on the property. | Land | Improvement |
|---|---|---|---|---|
| 2025 | $4,489 | $250,200 | $31,400 | $218,800 |
| 2024 | $3,777 | $204,700 | $27,000 | $177,700 |
| 2023 | $3,457 | $188,700 | $27,000 | $161,700 |
| 2022 | $3,268 | $176,100 | $23,600 | $152,500 |
| 2021 | $3,236 | $168,100 | $23,600 | $144,500 |
| 2020 | $3,215 | $163,100 | $23,600 | $139,500 |
| 2019 | $3,177 | $163,600 | $29,000 | $134,600 |
| 2018 | $3,148 | $157,300 | $29,000 | $128,300 |
| 2017 | $2,982 | $151,900 | $27,000 | $124,900 |
| 2016 | $2,900 | $154,600 | $27,000 | $127,600 |
| 2015 | $2,792 | $154,600 | $27,000 | $127,600 |
Source: Public Records
Map
Nearby Homes
- 68 Orchard St
- 71 Maplewood Ave
- 98 Lincoln St
- 0 Courtland Place
- 9 Myrtle St
- 33 Maplewood Ave Unit 305
- 33 Maplewood Ave Unit 103
- 51 Adam St
- 674 North St
- 33 Adam St
- 10 Stoddard Ave
- 29 Glenwood Ave
- 24 Glenwood Ave
- 26 Springside Ave
- 58 Seymour St
- 48 Brown St
- 52 Brown St
- 61 Seymour St
- 1 Rostone Place
- LOT 20 Plunkett St