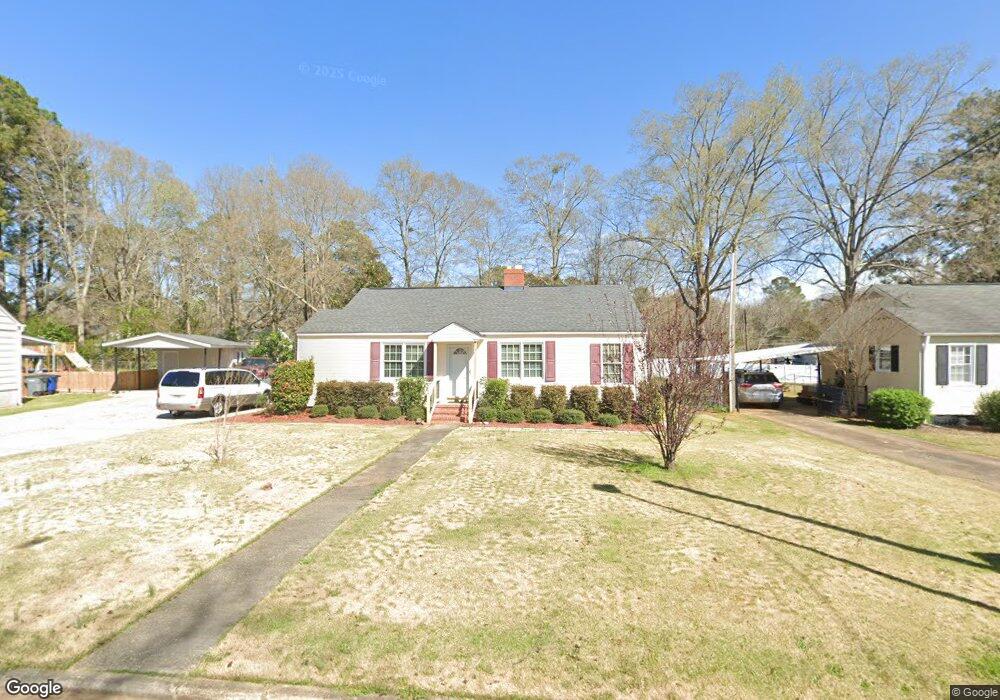
251 Beechwood Cir Lagrange, GA 30240
Estimated Value: $167,000 - $212,000
2
Beds
1
Bath
1,116
Sq Ft
$170/Sq Ft
Est. Value
About This Home
This home is located at 251 Beechwood Cir, Lagrange, GA 30240 and is currently estimated at $189,799, approximately $170 per square foot. 251 Beechwood Cir is a home located in Troup County with nearby schools including Franklin Forest Elementary School, Hollis Hand Elementary School, and Ethel W. Kight Elementary School.
Ownership History
Date
Name
Owned For
Owner Type
Purchase Details
Closed on
May 10, 1996
Sold by
Louise R Spence
Bought by
Ladonna S Parker
Current Estimated Value
Purchase Details
Closed on
May 1, 1996
Sold by
Mark A Killmer
Bought by
Louise R Spence
Purchase Details
Closed on
Feb 13, 1996
Sold by
Louise R Spence
Bought by
Mark A Killmer
Purchase Details
Closed on
Feb 1, 1996
Sold by
Mark A Killmer
Bought by
Louise R Spence
Purchase Details
Closed on
Jan 19, 1994
Sold by
Mcclung H
Bought by
Mark A Killmer
Purchase Details
Closed on
Dec 30, 1993
Sold by
Mcclung H
Bought by
Mcclung H
Purchase Details
Closed on
Apr 19, 1988
Sold by
Troy E Mcclung
Bought by
Mcclung H
Purchase Details
Closed on
Jun 15, 1984
Sold by
Mcclung
Bought by
Troy E Mcclung
Purchase Details
Closed on
Oct 1, 1982
Sold by
Mcclung Margaret
Bought by
Mcclung
Purchase Details
Closed on
Jan 1, 1959
Bought by
Mcclung Margaret
Create a Home Valuation Report for This Property
The Home Valuation Report is an in-depth analysis detailing your home's value as well as a comparison with similar homes in the area
Home Values in the Area
Average Home Value in this Area
Purchase History
| Date | Buyer | Sale Price | Title Company |
|---|---|---|---|
| Ladonna S Parker | -- | -- | |
| Louise R Spence | -- | -- | |
| Mark A Killmer | -- | -- | |
| Louise R Spence | $53,700 | -- | |
| Mark A Killmer | -- | -- | |
| Mcclung H | $45,000 | -- | |
| Mcclung H | $42,000 | -- | |
| Troy E Mcclung | $18,000 | -- | |
| Mcclung | -- | -- | |
| Mcclung Margaret | -- | -- |
Source: Public Records
Tax History Compared to Growth
Tax History
| Year | Tax Paid | Tax Assessment Tax Assessment Total Assessment is a certain percentage of the fair market value that is determined by local assessors to be the total taxable value of land and additions on the property. | Land | Improvement |
|---|---|---|---|---|
| 2024 | $734 | $53,808 | $18,000 | $35,808 |
| 2023 | $756 | $54,608 | $18,000 | $36,608 |
| 2022 | $622 | $48,648 | $14,000 | $34,648 |
| 2021 | $1,369 | $47,384 | $14,000 | $33,384 |
| 2020 | $1,092 | $38,192 | $10,000 | $28,192 |
| 2019 | $1,044 | $36,620 | $10,000 | $26,620 |
| 2018 | $1,044 | $36,620 | $10,000 | $26,620 |
| 2017 | $987 | $34,708 | $10,000 | $24,708 |
| 2016 | $986 | $34,683 | $10,000 | $24,683 |
| 2015 | $988 | $34,683 | $10,000 | $24,683 |
| 2014 | $672 | $24,198 | $8,000 | $16,198 |
| 2013 | -- | $25,105 | $8,000 | $17,105 |
Source: Public Records
Map
Nearby Homes
- 109 Thomas St
- 219 Banks St
- 145 Turner St
- 0 Ridley Ave Unit 10550104
- 900 North St
- 609 Ridley Ave
- 707 Ridley Ave
- 611 Ridley Ave
- 615 Ridley Ave
- 709 Ridley Ave
- 110 Russell St
- 408 Gordon St
- 105 Saynor Cir
- 748 Lakewood Dr
- 102 Ewing St
- 106 Ewing St
- 204 Colonial St
- 301 E Bacon St
- 724 Camellia Dr
- 109 Dogwood Dr
- 253 Beechwood Cir
- 249 Beechwood Cir
- 731 N Greenwood St
- 255 Beechwood Cir
- 729 N Greenwood St
- 733 N Greenwood St
- 226 Beechwood Cir
- 0 Beechwood Cir Unit 7305890
- 0 Beechwood Cir Unit 8403392
- 0 Beechwood Cir Unit 8213752
- 0 Beechwood Cir Unit 3204551
- 0 Beechwood Cir Unit 8274719
- 0 Beechwood Cir Unit 7206966
- 0 Beechwood Cir Unit 8369411
- 0 Beechwood Cir Unit 8250414
- 0 Beechwood Cir Unit 8055458
- 0 Beechwood Cir Unit 7464253
- 0 Beechwood Cir Unit 7408633
- 0 Beechwood Cir Unit 8819964
- 0 Beechwood Cir Unit 8398356