Estimated Value: $391,000 - $477,000
6
Beds
3
Baths
3,314
Sq Ft
$132/Sq Ft
Est. Value
About This Home
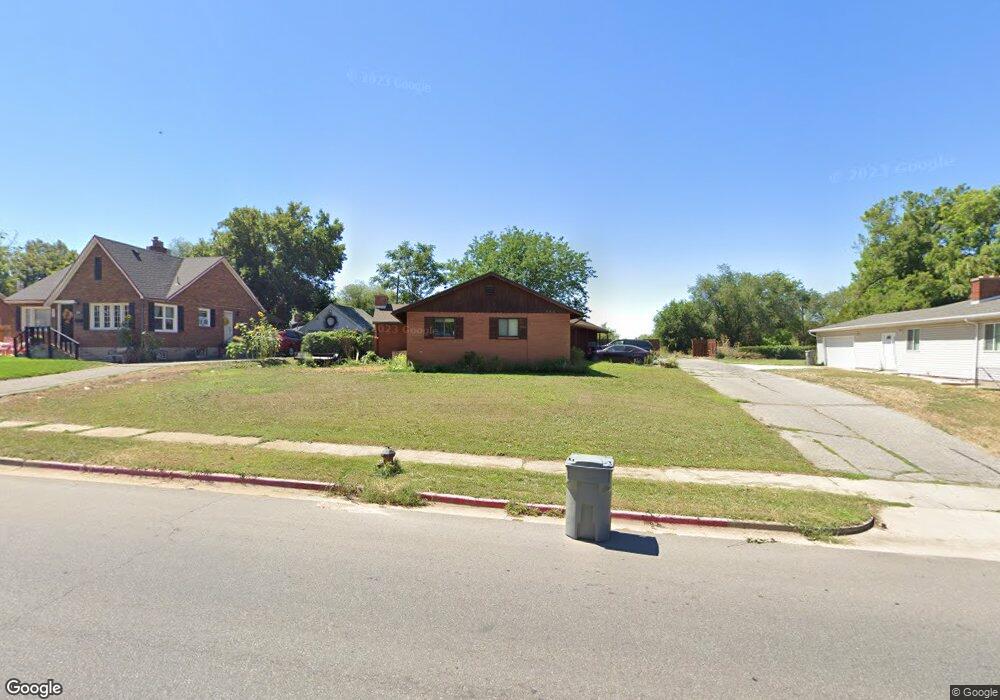
This home is located at 251 Chimes View Dr, Ogden, UT 84405 and is currently estimated at $436,481, approximately $131 per square foot. 251 Chimes View Dr is a home located in Weber County with nearby schools including Burch Creek School, South Ogden Junior High School, and Bonneville High School.
Ownership History
Date
Name
Owned For
Owner Type
Purchase Details
Closed on
May 6, 2013
Sold by
Nimori Marta F
Bought by
Spivey Gabriela J
Current Estimated Value
Home Financials for this Owner
Home Financials are based on the most recent Mortgage that was taken out on this home.
Original Mortgage
$143,400
Outstanding Balance
$101,751
Interest Rate
3.51%
Mortgage Type
VA
Estimated Equity
$334,730
Purchase Details
Closed on
Feb 16, 2011
Sold by
Nimori Marta F and West Marta Kay
Bought by
Nimori Marta F
Purchase Details
Closed on
Sep 1, 1998
Sold by
Willis Shirley A
Bought by
Nimori Kenneth N and Nimori Marta F
Purchase Details
Closed on
Sep 13, 1996
Sold by
Northstar Development Llc
Bought by
Nimori Kenneth
Create a Home Valuation Report for This Property
The Home Valuation Report is an in-depth analysis detailing your home's value as well as a comparison with similar homes in the area
Home Values in the Area
Average Home Value in this Area
Purchase History
| Date | Buyer | Sale Price | Title Company |
|---|---|---|---|
| Spivey Gabriela J | -- | First American Title Company | |
| Nimori Marta F | -- | None Available | |
| Nimori Kenneth N | -- | U S Title | |
| Nimori Kenneth | -- | Associated Title | |
| Nimori Kenneth | -- | Associated Title |
Source: Public Records
Mortgage History
| Date | Status | Borrower | Loan Amount |
|---|---|---|---|
| Open | Spivey Gabriela J | $143,400 |
Source: Public Records
Tax History Compared to Growth
Tax History
| Year | Tax Paid | Tax Assessment Tax Assessment Total Assessment is a certain percentage of the fair market value that is determined by local assessors to be the total taxable value of land and additions on the property. | Land | Improvement |
|---|---|---|---|---|
| 2025 | $354 | $278,283 | $51,086 | $227,197 |
| 2024 | $354 | $270,599 | $51,086 | $219,513 |
| 2023 | $325 | $237,050 | $50,242 | $186,808 |
| 2022 | $1,676 | $268,401 | $45,447 | $222,954 |
| 2021 | $2,261 | $307,000 | $48,537 | $258,463 |
| 2020 | $419 | $267,000 | $35,492 | $231,508 |
| 2019 | $282 | $238,000 | $26,917 | $211,083 |
| 2018 | $275 | $213,000 | $26,917 | $186,083 |
| 2017 | $1,852 | $202,000 | $24,361 | $177,639 |
| 2016 | $268 | $111,356 | $11,472 | $99,884 |
| 2015 | $1,653 | $97,334 | $11,472 | $85,862 |
| 2014 | $246 | $86,149 | $11,472 | $74,677 |
Source: Public Records
Map
Nearby Homes
- 26 Sylvia Dr
- 215 40th St
- 315 39th St
- 239 E Burch Creek Place
- 302 40th St
- 241 E Burch Creek Place
- 326 E 39th St
- 194 Country Club Dr
- 225 Chimes View Cir
- 4022 S Burch Creek Way
- 965 E 39th St
- 356 39th St
- 314 38th St
- 131 Country Club Dr
- 149 Country Club Dr
- 3756 Ogden Ave
- 254 36th St
- 260 36th St
- 516 Diana St
- 575 40th St
- 253 Chimes View Dr
- 241 Chimes View Dr
- 263 Chimes View Dr
- 231 Chimes View Dr
- 255 Chimes View Dr
- 257 Chimes View Dr
- 236 Chimes View Dr
- 266 Chimes View Dr
- 3890 Childs Ave
- 267 Chimes View Dr
- 227 Chimes View Dr
- 230 Chimes View Dr
- 225 Chimes View Dr
- 3874 Childs Ave
- 271 Chimes View Dr
- 10 Sylvia Dr
- 273 Chimes View Dr
- 203 Chimes View Dr
- 286 39th St
- 3860 Childs Ave