251 Corral Rd NE Milledgeville, GA 31061
Estimated Value: $1,025,000 - $1,618,000
3
Beds
3
Baths
2,432
Sq Ft
$558/Sq Ft
Est. Value
About This Home
This home is located at 251 Corral Rd NE, Milledgeville, GA 31061 and is currently estimated at $1,357,010, approximately $557 per square foot. 251 Corral Rd NE is a home located in Baldwin County with nearby schools including Lakeview Primary, Lakeview Academy, and Oak Hill Middle School.
Ownership History
Date
Name
Owned For
Owner Type
Purchase Details
Closed on
Nov 4, 2022
Sold by
York Wendell Odell
Bought by
J & B Lake Properties Llc
Current Estimated Value
Purchase Details
Closed on
Jan 6, 2020
Sold by
Wf Swearingen Llc
Bought by
York Wendell Odell and Mcbrayer Edwin Eugene
Home Financials for this Owner
Home Financials are based on the most recent Mortgage that was taken out on this home.
Original Mortgage
$440,000
Interest Rate
3.6%
Mortgage Type
New Conventional
Purchase Details
Closed on
Dec 28, 2012
Sold by
Swearingen William F
Bought by
Wf Swearingen Llc
Purchase Details
Closed on
Jun 20, 2007
Sold by
Block Betty Ann
Bought by
Swearingen William F
Purchase Details
Closed on
Jun 12, 2003
Sold by
Branch Banking
Bought by
Block Betty Ann
Purchase Details
Closed on
May 16, 2003
Sold by
Block
Bought by
Block Betty Ann
Purchase Details
Closed on
Aug 23, 1993
Bought by
Block
Create a Home Valuation Report for This Property
The Home Valuation Report is an in-depth analysis detailing your home's value as well as a comparison with similar homes in the area
Home Values in the Area
Average Home Value in this Area
Purchase History
| Date | Buyer | Sale Price | Title Company |
|---|---|---|---|
| J & B Lake Properties Llc | $1,325,000 | -- | |
| York Wendell Odell | $550,000 | -- | |
| Wf Swearingen Llc | $552,000 | -- | |
| Swearingen William F | $522,000 | -- | |
| Block Betty Ann | -- | -- | |
| Block Betty Ann | -- | -- | |
| Block | $91,000 | -- |
Source: Public Records
Mortgage History
| Date | Status | Borrower | Loan Amount |
|---|---|---|---|
| Previous Owner | York Wendell Odell | $440,000 |
Source: Public Records
Tax History Compared to Growth
Tax History
| Year | Tax Paid | Tax Assessment Tax Assessment Total Assessment is a certain percentage of the fair market value that is determined by local assessors to be the total taxable value of land and additions on the property. | Land | Improvement |
|---|---|---|---|---|
| 2025 | $10,130 | $415,676 | $176,400 | $239,276 |
| 2024 | $10,130 | $415,676 | $176,400 | $239,276 |
| 2023 | $6,294 | $258,284 | $117,600 | $140,684 |
| 2022 | $6,135 | $260,716 | $117,600 | $143,116 |
| 2021 | $5,699 | $220,000 | $106,120 | $113,880 |
| 2020 | $4,567 | $178,620 | $117,600 | $61,020 |
| 2019 | $4,576 | $178,620 | $117,600 | $61,020 |
| 2018 | $4,764 | $185,500 | $124,480 | $61,020 |
| 2017 | $3,924 | $181,020 | $117,600 | $63,420 |
| 2016 | $3,962 | $147,240 | $82,480 | $64,760 |
| 2015 | $3,970 | $147,240 | $82,480 | $64,760 |
| 2014 | $3,975 | $147,240 | $82,480 | $64,760 |
Source: Public Records
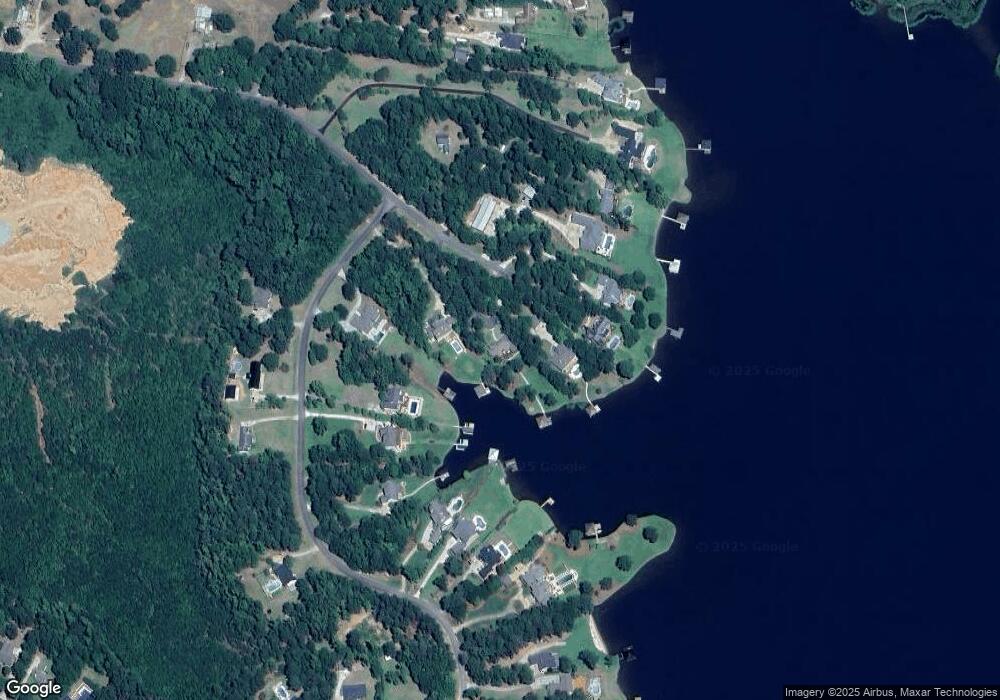
Map
Nearby Homes
- 211 Lakecrest Dr NE
- 205 Lakecrest Dr NE
- 105 Misenheimer Rd NE
- 106 Honeysuckle Ln NE
- 307 W Lakeview Dr NE
- 0313 W Lakeview Dr NE
- 111 Stewart Ave NE
- 196 Sinclair Marina Rd NE
- 190 Sinclair Marina Rd NE
- 745 Chickasaw Trail S
- 112 Russ Wood Rd NE
- 191 E Lakeview Dr
- 191A E Lakeview Dr NE Unit B
- 400 Southern Walk Dr
- 410 High Bluff Ct NE
- 185 E Lakeview Dr NE
- 514 High Bluff Ct NE
- 251 Southern Walk Dr NE
- 253 Corral Rd NE
- 235 Lakecrest Dr NE
- 255 Corral Rd NE
- 250 Corral Rd NE
- 231 Lakecrest Dr NE
- 248 Corral Rd NE
- 233 Lakecrest Dr NE
- 229 Lakecrest Dr NE
- 246 Corral Rd NE
- 221 Lakecrest Dr NE
- 227 Lakecrest Dr NE Unit 6-6 & 5 A
- 227 Lakecrest Dr NE
- 227 Lakecrest Dr NE Unit 6
- 219 Lakecrest Dr NE
- 244 Corral Rd NE
- 225 Lakecrest Dr NE
- 234 Lakecrest Dr NE
- 242 Corral Rd NE
- 215 Lakecrest Dr NE
- 232 Lakecrest Dr NE