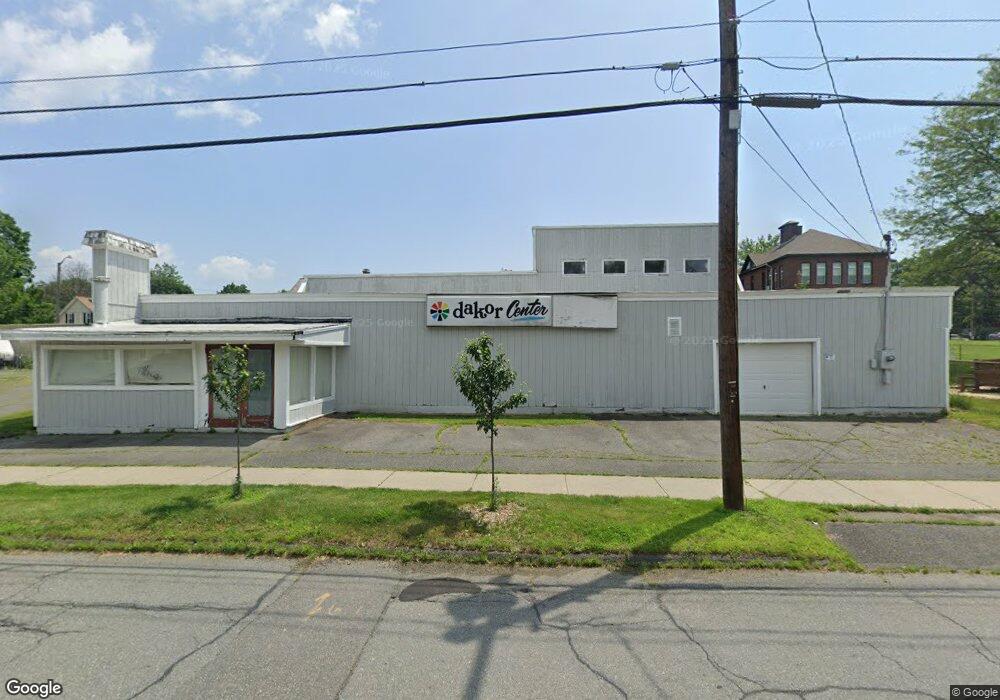
251 Davis St Greenfield, MA 01301
Studio
--
Bath
10,631
Sq Ft
23,522
Sq Ft Lot
About This Home
This home is located at 251 Davis St, Greenfield, MA 01301. 251 Davis St is a home located in Franklin County with nearby schools including Cornerstone Christian School and Holy Trinity School.
Ownership History
Date
Name
Owned For
Owner Type
Purchase Details
Closed on
Jun 1, 2022
Sold by
Zaccheo Mark
Bought by
Olive Street Dev Llc
Purchase Details
Closed on
Sep 10, 2013
Sold by
Dakor Nt and Haggerty
Bought by
Zaccheo Mark A and Zaccheo Barbara N
Home Financials for this Owner
Home Financials are based on the most recent Mortgage that was taken out on this home.
Original Mortgage
$130,000
Interest Rate
4.34%
Mortgage Type
Commercial
Create a Home Valuation Report for This Property
The Home Valuation Report is an in-depth analysis detailing your home's value as well as a comparison with similar homes in the area
Home Values in the Area
Average Home Value in this Area
Purchase History
| Date | Buyer | Sale Price | Title Company |
|---|---|---|---|
| Olive Street Dev Llc | -- | None Available | |
| Olive Street Dev Llc | -- | None Available | |
| Spencer Mark | -- | None Available | |
| Spencer Mark S | -- | None Available | |
| Zaccheo Mark A | $110,000 | -- | |
| Zaccheo Mark | $110,000 | -- |
Source: Public Records
Mortgage History
| Date | Status | Borrower | Loan Amount |
|---|---|---|---|
| Previous Owner | Zaccheo Mark | $130,000 | |
| Previous Owner | Zaccheo Mark A | $185,000 |
Source: Public Records
Tax History
| Year | Tax Paid | Tax Assessment Tax Assessment Total Assessment is a certain percentage of the fair market value that is determined by local assessors to be the total taxable value of land and additions on the property. | Land | Improvement |
|---|---|---|---|---|
| 2025 | $5,176 | $264,600 | $76,600 | $188,000 |
| 2024 | $5,522 | $270,800 | $72,900 | $197,900 |
| 2023 | $4,877 | $248,200 | $66,400 | $181,800 |
| 2022 | $5,341 | $239,300 | $63,300 | $176,000 |
| 2021 | $5,591 | $240,800 | $58,900 | $181,900 |
| 2020 | $5,141 | $224,200 | $58,900 | $165,300 |
| 2019 | $5,013 | $224,200 | $58,900 | $165,300 |
| 2018 | $4,578 | $204,100 | $55,500 | $148,600 |
| 2017 | $4,435 | $204,100 | $55,500 | $148,600 |
| 2016 | $4,181 | $191,700 | $55,500 | $136,200 |
| 2015 | $4,317 | $191,800 | $55,500 | $136,300 |
| 2014 | $4,537 | $221,000 | $55,500 | $165,500 |
Source: Public Records
Map
Nearby Homes
Your Personal Tour Guide
Ask me questions while you tour the home.