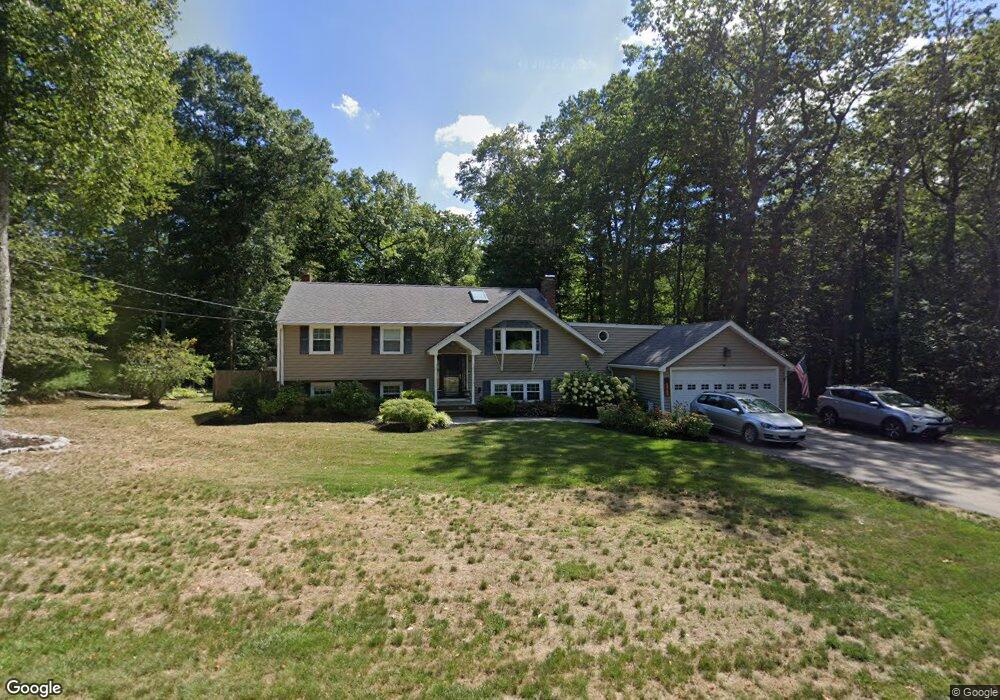
251 Dillingham Way Hanover, MA 02339
Estimated Value: $615,000 - $742,000
4
Beds
2
Baths
1,306
Sq Ft
$535/Sq Ft
Est. Value
About This Home
This home is located at 251 Dillingham Way, Hanover, MA 02339 and is currently estimated at $698,993, approximately $535 per square foot. 251 Dillingham Way is a home located in Plymouth County with nearby schools including Hanover High School, South Shore Charter Public School, and Norwell KinderCare.
Ownership History
Date
Name
Owned For
Owner Type
Purchase Details
Closed on
Dec 7, 1999
Sold by
Pandian Natesa and Pandian Kannagi
Bought by
Obreza Steven S
Current Estimated Value
Create a Home Valuation Report for This Property
The Home Valuation Report is an in-depth analysis detailing your home's value as well as a comparison with similar homes in the area
Home Values in the Area
Average Home Value in this Area
Purchase History
We collect this data history from publicly available records. To have your information removed, we recommend requesting removal directly through your county’s website.
| Date | Buyer | Sale Price | Title Company |
|---|---|---|---|
| Obreza Steven S | $255,000 | -- | |
| Obreza Steven S | $255,000 | -- |
Source: Public Records
Mortgage History
We collect this data history from publicly available records. To have your information removed, we recommend requesting removal directly through your county’s website.
| Date | Status | Borrower | Loan Amount |
|---|---|---|---|
| Open | Obreza Steven S | $400,000 | |
| Closed | Obreza Steven S | $130,000 | |
| Closed | Obreza Steven S | $263,217 |
Source: Public Records
Tax History
| Year | Tax Paid | Tax Assessment Tax Assessment Total Assessment is a certain percentage of the fair market value that is determined by local assessors to be the total taxable value of land and additions on the property. | Land | Improvement |
|---|---|---|---|---|
| 2025 | $7,923 | $641,500 | $271,100 | $370,400 |
| 2024 | $7,904 | $615,600 | $271,100 | $344,500 |
| 2023 | $7,857 | $582,400 | $246,400 | $336,000 |
| 2022 | $8,125 | $532,800 | $246,400 | $286,400 |
| 2021 | $7,827 | $479,300 | $224,100 | $255,200 |
| 2020 | $8,820 | $479,500 | $224,100 | $255,400 |
| 2019 | $7,296 | $444,600 | $224,100 | $220,500 |
| 2018 | $7,170 | $440,400 | $224,100 | $216,300 |
| 2017 | $7,080 | $428,600 | $212,900 | $215,700 |
| 2016 | $6,901 | $409,300 | $193,600 | $215,700 |
| 2015 | $5,976 | $370,000 | $193,600 | $176,400 |
Source: Public Records
Map
Nearby Homes
- 569 Main St
- 11 Duncan Dr
- 15 Leigh Rd
- 9 Douglas Ave
- 25 Buffum Rd
- 392 Cedar St
- 36 Ea Joseph Dr
- 250 Main St
- 239 Washington St Unit 20
- 286 Mayflower Cir
- 214 Washington St Unit 28
- 28 Lantern Ln
- 20 Jackson Rd
- 87 Franklin Rd
- 18 W End Way Unit 18W
- 16 Holly Ct
- 205 Pleasant St
- 283 Pond St
- 3 Brattle Rd
- 251 Prospect St
- 275 Dillingham Way
- 225 Old Town Way
- 197 Old Town Way
- 222 Old Town Way
- 237 Old Town Way
- 289 Dillingham Way
- 198 Old Town Way
- 234 Old Town Way
- 254 Dillingham Way
- 239 Dillingham Way
- 242 Dillingham Way
- 184 Old Town Way
- 246 Old Town Way
- 173 Old Town Way
- 227 Dillingham Way
- 249 Old Town Way
- 308 Dillingham Way
- 172 Old Town Way
- 309 Dillingham Way
- 230 Dillingham Way
Your Personal Tour Guide
Ask me questions while you tour the home.