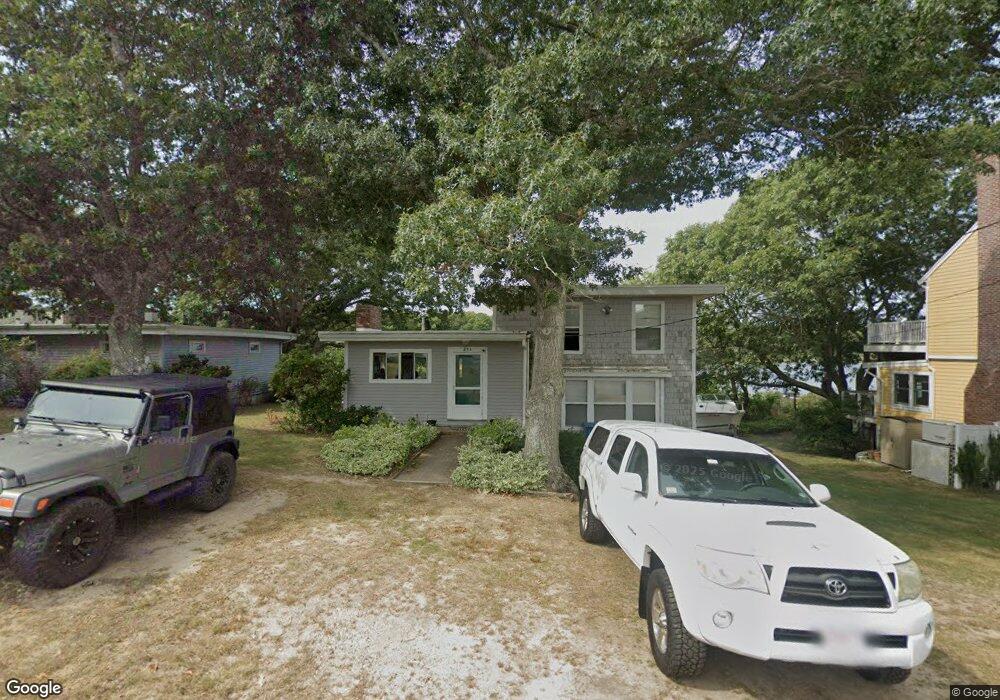
251 Edgewater Dr W East Falmouth, MA 02536
East Falmouth NeighborhoodEstimated Value: $911,000 - $1,503,000
4
Beds
3
Baths
1,845
Sq Ft
$649/Sq Ft
Est. Value
About This Home
This home is located at 251 Edgewater Dr W, East Falmouth, MA 02536 and is currently estimated at $1,197,360, approximately $648 per square foot. 251 Edgewater Dr W is a home located in Barnstable County with nearby schools including East Falmouth Elementary School, Morse Pond School, and Lawrence School.
Ownership History
Date
Name
Owned For
Owner Type
Purchase Details
Closed on
Mar 18, 2011
Sold by
Peterson Janet M and William Peterson
Bought by
Peterson Irt and Picardi
Current Estimated Value
Purchase Details
Closed on
Jan 1, 1969
Bought by
Peterson Irt
Create a Home Valuation Report for This Property
The Home Valuation Report is an in-depth analysis detailing your home's value as well as a comparison with similar homes in the area
Home Values in the Area
Average Home Value in this Area
Purchase History
| Date | Buyer | Sale Price | Title Company |
|---|---|---|---|
| Peterson Irt | -- | -- | |
| Peterson Irt | -- | -- | |
| Peterson Janet M | -- | -- | |
| Peterson Irt | -- | -- |
Source: Public Records
Tax History Compared to Growth
Tax History
| Year | Tax Paid | Tax Assessment Tax Assessment Total Assessment is a certain percentage of the fair market value that is determined by local assessors to be the total taxable value of land and additions on the property. | Land | Improvement |
|---|---|---|---|---|
| 2025 | $6,112 | $1,041,300 | $662,400 | $378,900 |
| 2024 | $5,828 | $928,000 | $576,000 | $352,000 |
| 2023 | $5,929 | $856,800 | $547,200 | $309,600 |
| 2022 | $6,219 | $772,500 | $487,900 | $284,600 |
| 2021 | $6,306 | $741,900 | $487,900 | $254,000 |
| 2020 | $5,992 | $697,500 | $443,500 | $254,000 |
| 2019 | $5,592 | $653,300 | $443,500 | $209,800 |
| 2018 | $5,452 | $634,000 | $443,500 | $190,500 |
| 2017 | $5,351 | $627,300 | $443,500 | $183,800 |
| 2016 | $5,251 | $627,300 | $443,500 | $183,800 |
| 2015 | $5,138 | $627,300 | $443,500 | $183,800 |
| 2014 | $5,089 | $624,400 | $443,500 | $180,900 |
Source: Public Records
Map
Nearby Homes
- 231 Edgewater Dr W
- 15 Ovington Dr
- 285 Edgewater Dr W
- 0 Tobey Ln
- 53 Eel River Rd
- 381 Seacoast Shores Blvd
- 42 Hanson Cir
- 11 Pershing Dr
- 15 Pershing Dr
- 7 Yale Dr
- 23 N Bournes Pond Rd
- 23 N Bournes Pond Rd
- 23 Meadowood Ln
- 27 Emerald Ln
- 52 Bacon Farm Rd
- 30 Weatherglass Ln
- 0 Elsies Way Unit 22505181
- 0 Elsies Way Unit 73443603
- 14 Old Meeting House Rd
- 45 Green Pond Rd
- 255 Edgewater Dr W
- 257 Edgewater Dr W
- 256 Edgewater Dr W
- 247 Edgewater Dr W
- 259 Edgewater Dr W
- 4 Winthrop Dr
- 245 Edgewater Dr W
- 4 Ellsworth Dr
- 241 Edgewater Dr W
- 244 Edgewater Dr W
- 7 Winthrop Dr
- 263 Edgewater Dr W
- 8 Winthrop Dr
- 10 Ellsworth Dr
- 267 Edgewater Dr W
- 3 Ellsworth Dr
- 11 Bayside Dr
- 11 Winthrop Dr
- 11 Winthrop Dr
- 12 Winthrop Dr