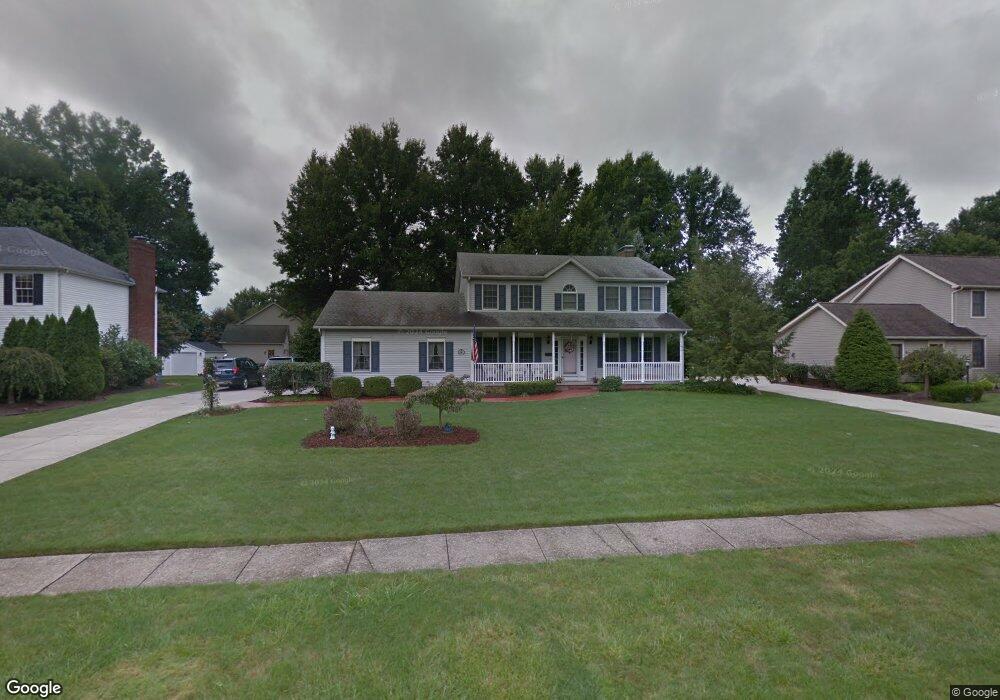
251 Hilltop Blvd Canfield, OH 44406
Estimated Value: $356,000 - $442,000
4
Beds
3
Baths
2,552
Sq Ft
$159/Sq Ft
Est. Value
About This Home
This home is located at 251 Hilltop Blvd, Canfield, OH 44406 and is currently estimated at $405,082, approximately $158 per square foot. 251 Hilltop Blvd is a home located in Mahoning County with nearby schools including Canfield Village Middle School, Canfield High School, and St Charles Elementary School.
Ownership History
Date
Name
Owned For
Owner Type
Purchase Details
Closed on
Mar 9, 2023
Sold by
Gamberale Mary C
Bought by
Mary C Gamberale Revocable Living Trust and Gamberale
Current Estimated Value
Purchase Details
Closed on
Mar 1, 2023
Sold by
Gamberale Frank
Bought by
Gamberale Mary C
Purchase Details
Closed on
May 8, 2021
Sold by
Gamberale Frank and Gamberale Mary C
Bought by
Gamberale Frank and Gamberale Mary C
Purchase Details
Closed on
Apr 22, 2003
Sold by
Mapes Lois M
Bought by
Gamberale Frank and Daniels Mary C
Home Financials for this Owner
Home Financials are based on the most recent Mortgage that was taken out on this home.
Original Mortgage
$162,400
Interest Rate
5.95%
Mortgage Type
Purchase Money Mortgage
Purchase Details
Closed on
May 17, 1990
Bought by
Mapes Peter E and Mapes Lois M
Create a Home Valuation Report for This Property
The Home Valuation Report is an in-depth analysis detailing your home's value as well as a comparison with similar homes in the area
Home Values in the Area
Average Home Value in this Area
Purchase History
| Date | Buyer | Sale Price | Title Company |
|---|---|---|---|
| Mary C Gamberale Revocable Living Trust | -- | None Listed On Document | |
| Mary C Gamberale Revocable Living Trust | -- | None Listed On Document | |
| Gamberale Mary C | -- | -- | |
| Gamberale Frank | -- | None Available | |
| Gamberale Frank | -- | -- | |
| Mapes Peter E | $124,000 | -- |
Source: Public Records
Mortgage History
| Date | Status | Borrower | Loan Amount |
|---|---|---|---|
| Previous Owner | Gamberale Frank | $162,400 |
Source: Public Records
Tax History Compared to Growth
Tax History
| Year | Tax Paid | Tax Assessment Tax Assessment Total Assessment is a certain percentage of the fair market value that is determined by local assessors to be the total taxable value of land and additions on the property. | Land | Improvement |
|---|---|---|---|---|
| 2024 | $4,977 | $115,500 | $13,760 | $101,740 |
| 2023 | $4,898 | $115,500 | $13,760 | $101,740 |
| 2022 | $4,742 | $88,970 | $13,760 | $75,210 |
| 2021 | $4,602 | $88,970 | $13,760 | $75,210 |
| 2020 | $4,621 | $88,970 | $13,760 | $75,210 |
| 2019 | $4,545 | $79,440 | $12,290 | $67,150 |
| 2018 | $4,489 | $79,440 | $12,290 | $67,150 |
| 2017 | $4,486 | $79,440 | $12,290 | $67,150 |
| 2016 | $3,961 | $71,440 | $13,920 | $57,520 |
| 2015 | $3,874 | $71,440 | $13,920 | $57,520 |
| 2014 | $3,685 | $67,690 | $13,920 | $53,770 |
| 2013 | $3,552 | $67,690 | $13,920 | $53,770 |
Source: Public Records
Map
Nearby Homes
- 301 Hilltop Blvd
- 321 Hilltop Blvd
- 201 Talsman Dr Unit 1
- 211 Talsman Dr Unit 1
- 120 Talsman Dr Unit 4
- 100 Talsman Dr
- 58 Skyline Dr
- 78 Neff Dr
- 38 Skyline Dr
- 125 Callahan Rd
- 419 Carriage Hill Dr
- 473 Carriage Hill Dr
- 395 N Broad St
- 0 Shields Rd Unit 5162190
- 0 Shields Rd Unit 5120471
- 0 Shields Rd Unit 4503758
- 6020 Century Blvd
- 6859 Fairground Blvd
- 9 Willow Way
- 21 Villa Theresa Ln
- 241 Hilltop Blvd
- 261 Hilltop Blvd
- 270 Montgomery Dr
- 231 Hilltop Blvd
- 151 Neff Ct
- 141 Neff Ct
- 221 Hilltop Blvd
- 251 Montgomery Dr
- 311 Hilltop Blvd
- 250 Montgomery Dr
- 2115 Neff Ct
- 211 Hilltop Blvd
- 131 Neff Ct
- 150 Neff Ct
- 2212 Neff Ct
- 240 Montgomery Dr
- 10 Montgomery Ct
- 201 Hilltop Blvd
- 121 Neff Ct
- 331 Hilltop Blvd