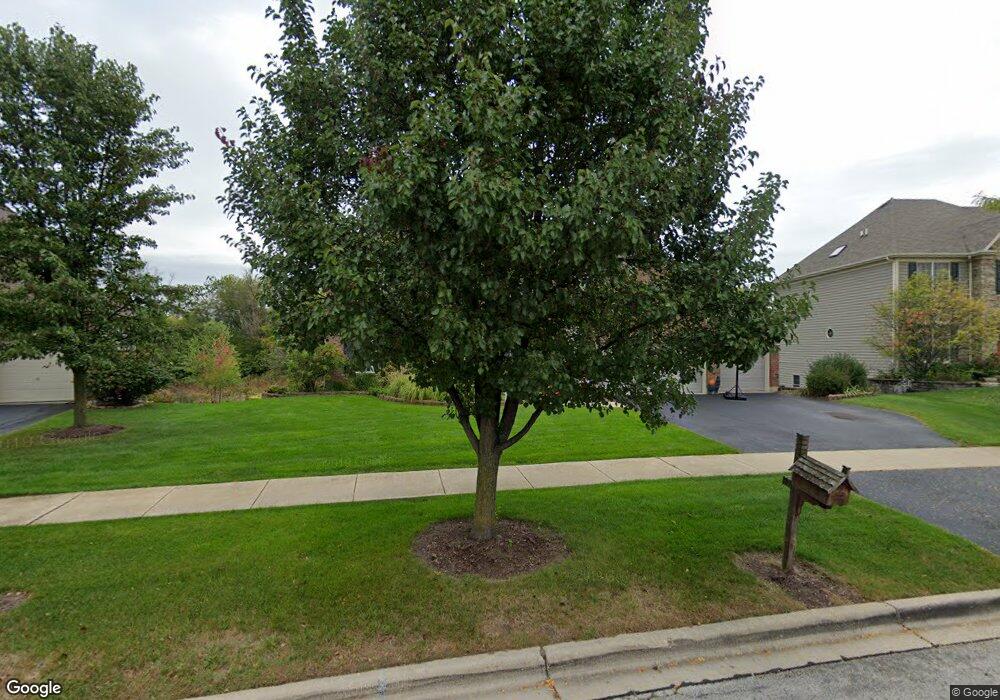
251 Johnson Woods Dr Batavia, IL 60510
Woodland Hills NeighborhoodEstimated Value: $659,202 - $752,000
4
Beds
--
Bath
3,240
Sq Ft
$222/Sq Ft
Est. Value
About This Home
This home is located at 251 Johnson Woods Dr, Batavia, IL 60510 and is currently estimated at $719,301, approximately $222 per square foot. 251 Johnson Woods Dr is a home located in Kane County with nearby schools including J B Nelson Elementary School, Sam Rotolo Middle School, and Batavia Sr High School.
Ownership History
Date
Name
Owned For
Owner Type
Purchase Details
Closed on
Feb 20, 2008
Sold by
Sokolowski Mona E
Bought by
Parmelee Clifford and Parmelee Nicole
Current Estimated Value
Purchase Details
Closed on
Mar 12, 2004
Sold by
Wyndham Deerpoint Homes
Bought by
Parmelee Clifford and Parmelee Nicole R
Home Financials for this Owner
Home Financials are based on the most recent Mortgage that was taken out on this home.
Original Mortgage
$333,700
Interest Rate
5.78%
Mortgage Type
Purchase Money Mortgage
Purchase Details
Closed on
Oct 7, 2003
Sold by
Johnson Woods Llc
Bought by
Wyndham Deerpoint Homes
Home Financials for this Owner
Home Financials are based on the most recent Mortgage that was taken out on this home.
Original Mortgage
$384,000
Interest Rate
6.49%
Mortgage Type
Construction
Create a Home Valuation Report for This Property
The Home Valuation Report is an in-depth analysis detailing your home's value as well as a comparison with similar homes in the area
Home Values in the Area
Average Home Value in this Area
Purchase History
| Date | Buyer | Sale Price | Title Company |
|---|---|---|---|
| Parmelee Clifford | -- | First American Title Ins Co | |
| Parmelee Clifford | $497,500 | Chicago Title Insurance Comp | |
| Wyndham Deerpoint Homes | -- | Chicago Title Insurance Co |
Source: Public Records
Mortgage History
| Date | Status | Borrower | Loan Amount |
|---|---|---|---|
| Previous Owner | Parmelee Clifford | $333,700 | |
| Previous Owner | Wyndham Deerpoint Homes | $384,000 |
Source: Public Records
Tax History Compared to Growth
Tax History
| Year | Tax Paid | Tax Assessment Tax Assessment Total Assessment is a certain percentage of the fair market value that is determined by local assessors to be the total taxable value of land and additions on the property. | Land | Improvement |
|---|---|---|---|---|
| 2024 | $13,767 | $182,127 | $21,624 | $160,503 |
| 2023 | $13,498 | $165,299 | $19,626 | $145,673 |
| 2022 | $13,461 | $160,158 | $18,342 | $141,816 |
| 2021 | $14,559 | $170,236 | $17,396 | $152,840 |
| 2020 | $14,206 | $166,964 | $17,062 | $149,902 |
| 2019 | $13,983 | $161,053 | $16,458 | $144,595 |
| 2018 | $14,058 | $161,806 | $10,625 | $151,181 |
| 2017 | $13,728 | $156,471 | $10,275 | $146,196 |
| 2016 | $13,445 | $151,914 | $9,976 | $141,938 |
| 2015 | -- | $148,455 | $9,749 | $138,706 |
| 2014 | -- | $143,782 | $9,442 | $134,340 |
| 2013 | -- | $151,878 | $13,226 | $138,652 |
Source: Public Records
Map
Nearby Homes
- 1025 E Wilson St
- 1267 Foxglove Dr
- 1273 Foxglove Dr
- 1277 Foxglove Dr
- 1283 Foxglove Dr
- 1285 Foxglove Dr
- Lot 1 Center St
- 133 Mayflower Dr
- 1384 Foxglove Dr
- 637 E Wilson St
- 4 Mayflower Dr
- 817 Woodland Hills Rd
- 1136 Pine Ct
- 428 E Wilson St
- 621 Young Ave
- 129 S Prairie St
- 1017 Willow Ln Unit 2
- 943 Orchard Ct
- 323 Church St
- 820 N Van Buren St
- 249 Johnson Woods Dr
- 261 Johnson Woods Dr
- 247 Johnson Woods Dr
- 263 Johnson Woods Dr
- 235 Johnson Woods Dr
- 200 Stafney Dr
- 275 Stafney Dr
- 274 Johnson Woods Dr
- 275 Johnson Woods Dr
- 264 Stafney Dr
- 229 Johnson Woods Dr
- 301 Stafney Dr
- 211 Robinson Way
- 342 Johnson Woods Dr
- 301 Johnson Woods Dr
- 265 Robinson Way
- 312 Stafney Dr
- 223 Johnson Woods Dr
- 353 Stafney Dr
- 335 Johnson Woods Dr