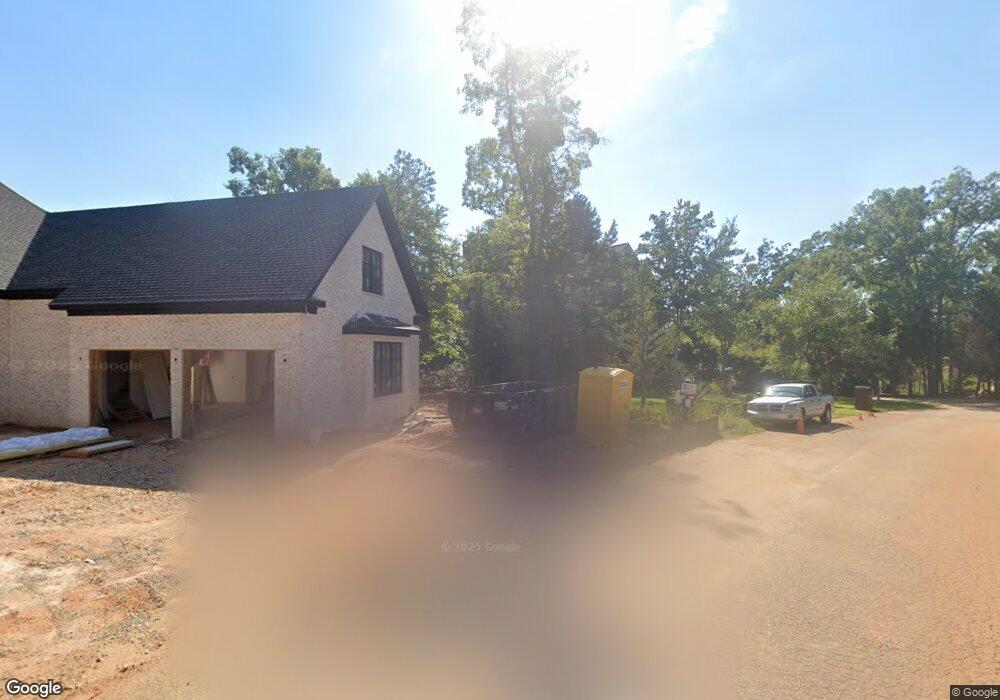
251 Little Gap Ln Chapin, SC 29036
Estimated Value: $1,736,000 - $2,472,838
6
Beds
7
Baths
7,820
Sq Ft
$277/Sq Ft
Est. Value
About This Home
This home is located at 251 Little Gap Ln, Chapin, SC 29036 and is currently estimated at $2,166,960, approximately $277 per square foot. 251 Little Gap Ln is a home located in Lexington County with nearby schools including Chapin Elementary School, Chapin Intermediate, and Chapin High School.
Ownership History
Date
Name
Owned For
Owner Type
Purchase Details
Closed on
Aug 19, 2015
Sold by
Bass Kenneth Allison
Bought by
Rippen Helga E and Dejesus Rafael
Current Estimated Value
Home Financials for this Owner
Home Financials are based on the most recent Mortgage that was taken out on this home.
Original Mortgage
$990,000
Outstanding Balance
$743,118
Interest Rate
2.75%
Mortgage Type
Adjustable Rate Mortgage/ARM
Estimated Equity
$1,423,842
Purchase Details
Closed on
Apr 23, 2012
Sold by
Estate Of Judith Anne Young Bass and Smith Shannon Alyson Bass
Bought by
Bass Kenneth Allison
Purchase Details
Closed on
Apr 11, 2007
Sold by
Bass Judith A
Bought by
Bass Judith A and Bass Kenneth Allison
Home Financials for this Owner
Home Financials are based on the most recent Mortgage that was taken out on this home.
Original Mortgage
$1,477,000
Interest Rate
6.1%
Mortgage Type
Purchase Money Mortgage
Purchase Details
Closed on
Apr 8, 2005
Sold by
Phillips Don E
Bought by
Zaderej Tony J and Zaderej Karen L
Create a Home Valuation Report for This Property
The Home Valuation Report is an in-depth analysis detailing your home's value as well as a comparison with similar homes in the area
Home Values in the Area
Average Home Value in this Area
Purchase History
| Date | Buyer | Sale Price | Title Company |
|---|---|---|---|
| Rippen Helga E | $1,237,500 | -- | |
| Bass Kenneth Allison | -- | -- | |
| Bass Judith A | -- | None Available | |
| Zaderej Tony J | $380,000 | -- |
Source: Public Records
Mortgage History
| Date | Status | Borrower | Loan Amount |
|---|---|---|---|
| Open | Rippen Helga E | $990,000 | |
| Previous Owner | Bass Judith A | $1,477,000 |
Source: Public Records
Tax History Compared to Growth
Tax History
| Year | Tax Paid | Tax Assessment Tax Assessment Total Assessment is a certain percentage of the fair market value that is determined by local assessors to be the total taxable value of land and additions on the property. | Land | Improvement |
|---|---|---|---|---|
| 2024 | $9,008 | $56,926 | $16,899 | $40,027 |
| 2023 | $8,319 | $56,926 | $16,899 | $40,027 |
| 2022 | $8,407 | $56,926 | $16,899 | $40,027 |
| 2020 | $8,809 | $56,926 | $16,899 | $40,027 |
| 2019 | $7,741 | $49,500 | $13,760 | $35,740 |
| 2018 | $6,807 | $49,500 | $13,760 | $35,740 |
| 2017 | $6,628 | $49,500 | $13,760 | $35,740 |
| 2016 | $7,156 | $49,499 | $13,760 | $35,739 |
| 2014 | $7,695 | $53,412 | $13,800 | $39,612 |
| 2013 | -- | $53,410 | $13,800 | $39,610 |
Source: Public Records
Map
Nearby Homes
- 155A Torrey Pine Ln
- 528 Links Pointe Ct
- 509 Links Pointe Ct
- 416 Lookover Pointe Dr
- 808 Island Point Ln
- 637 Misty Banks Dr
- 1061 Refuge Place
- 1068 Refuge Place
- 302 Lookout Hill Dr
- 0 Salisbury Ct
- 854 Elms Spinney Ln
- 912 Salisbury Ct
- 831 Elms Spinney Ln
- 908 Salisbury Ct
- 616 Misty Banks Dr
- 338 Lake Estate Dr
- 824 Elms Spinney Ln
- 828 Elms Spinney Ln
- 827 Elms Spinney Ln
- 0 Misty Banks Dr Unit 605235
- 250 Little Gap Ln
- 246 Little Gap Ln
- 259 Little Gap Ln
- 254 Little Gap Ln
- 243 Little Gap Ln
- 242 Little Gap Ln
- 263 Little Gap Ln
- 258 Little Gap Ln
- 301 Little Gap Ct
- 255 Little Gap Ct
- 262 Little Gap Ln
- 305 Little Gap Ct
- Lot 47 Little Gap Ln
- Lot 48 Little Gap Ln
- Lot 44 Little Gap Ln
- Lot 50 Little Gap Ln
- Lot 49 Little Gap Ln
- Lot 51 Little Gap Ln
- Lot 43 Little Gap Ln
- Lot 45 Little Gap Ln