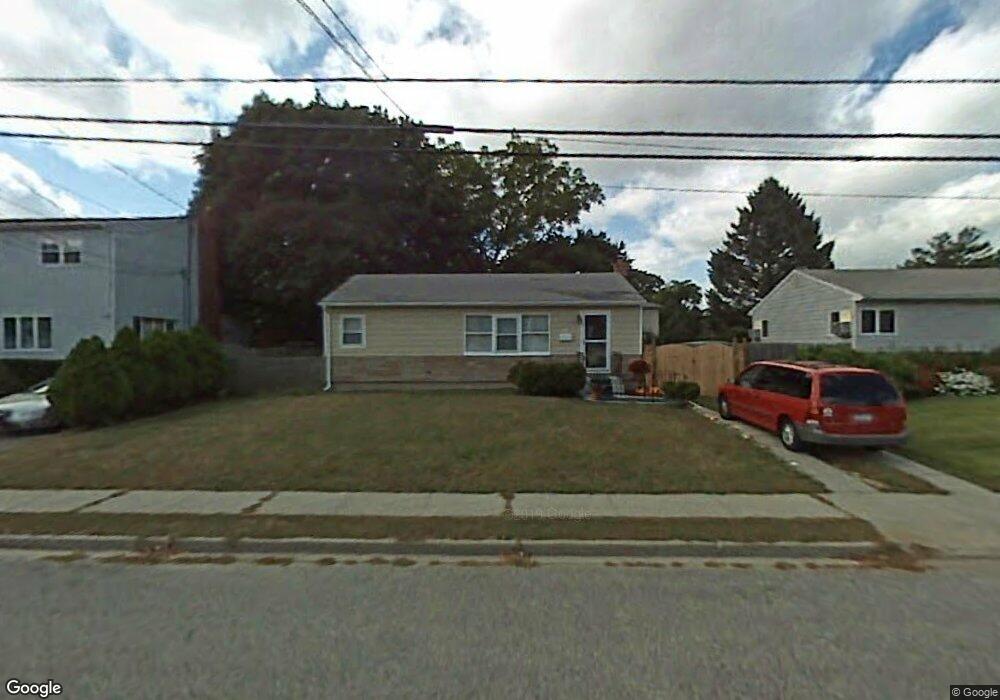
251 N 2nd St Bethpage, NY 11714
Estimated Value: $970,000 - $1,050,063
--
Bed
1
Bath
2,255
Sq Ft
$448/Sq Ft
Est. Value
About This Home
This home is located at 251 N 2nd St, Bethpage, NY 11714 and is currently estimated at $1,010,032, approximately $447 per square foot. 251 N 2nd St is a home located in Nassau County with nearby schools including Charles Campagne Elementary School, John F Kennedy Middle School, and Bethpage Senior High School.
Ownership History
Date
Name
Owned For
Owner Type
Purchase Details
Closed on
Dec 30, 2010
Sold by
Tortorella Anne
Bought by
Maggio Lawrence
Current Estimated Value
Home Financials for this Owner
Home Financials are based on the most recent Mortgage that was taken out on this home.
Original Mortgage
$357,875
Outstanding Balance
$242,114
Interest Rate
4.62%
Mortgage Type
FHA
Estimated Equity
$767,918
Purchase Details
Closed on
Mar 16, 1995
Sold by
Ingino Dominick Est
Bought by
Tortorella Anne and Maggio Mary
Create a Home Valuation Report for This Property
The Home Valuation Report is an in-depth analysis detailing your home's value as well as a comparison with similar homes in the area
Home Values in the Area
Average Home Value in this Area
Purchase History
| Date | Buyer | Sale Price | Title Company |
|---|---|---|---|
| Maggio Lawrence | $370,000 | -- | |
| Tortorella Anne | $80,000 | -- |
Source: Public Records
Mortgage History
| Date | Status | Borrower | Loan Amount |
|---|---|---|---|
| Open | Maggio Lawrence | $357,875 |
Source: Public Records
Tax History Compared to Growth
Tax History
| Year | Tax Paid | Tax Assessment Tax Assessment Total Assessment is a certain percentage of the fair market value that is determined by local assessors to be the total taxable value of land and additions on the property. | Land | Improvement |
|---|---|---|---|---|
| 2025 | $21,634 | $775 | $247 | $528 |
| 2024 | $7,448 | $775 | $247 | $528 |
| 2023 | $20,425 | $775 | $247 | $528 |
| 2022 | $20,425 | $775 | $247 | $528 |
| 2021 | $20,623 | $752 | $240 | $512 |
| 2020 | $20,260 | $1,107 | $453 | $654 |
| 2019 | $19,622 | $1,164 | $477 | $687 |
| 2018 | $19,000 | $1,360 | $0 | $0 |
| 2017 | $12,690 | $1,360 | $557 | $803 |
| 2016 | $19,679 | $1,360 | $557 | $803 |
| 2015 | $6,165 | $1,360 | $557 | $803 |
| 2014 | $6,165 | $1,360 | $557 | $803 |
| 2013 | $5,590 | $1,360 | $557 | $803 |
Source: Public Records
Map
Nearby Homes