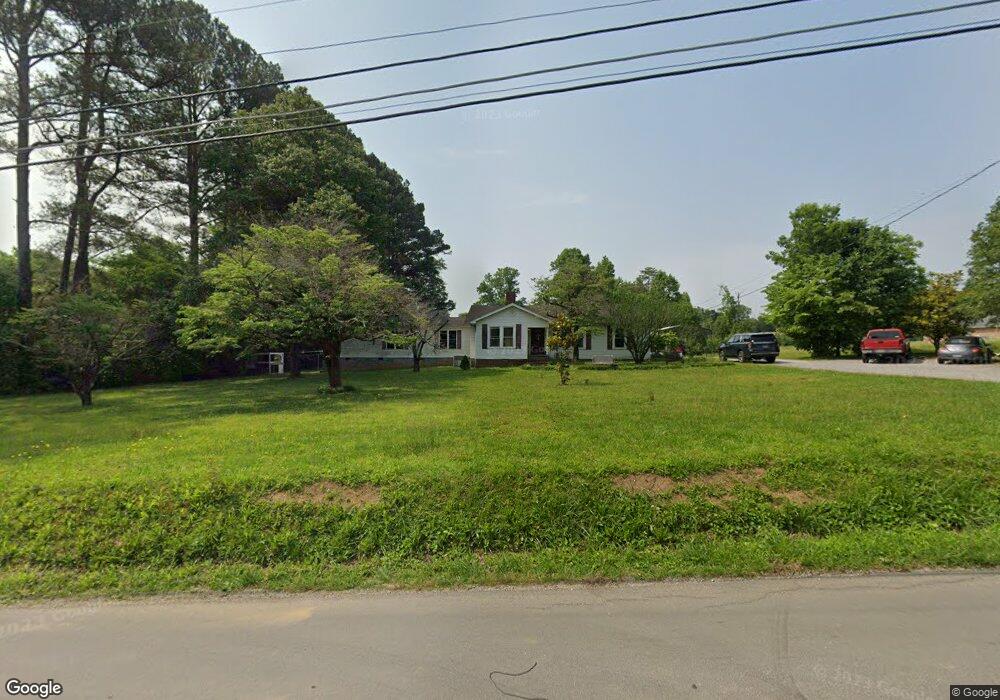
251 N Nick A Jack Rd Flintstone, GA 30725
Flintstone NeighborhoodEstimated Value: $261,402 - $306,000
3
Beds
1
Bath
1,408
Sq Ft
$204/Sq Ft
Est. Value
About This Home
This home is located at 251 N Nick A Jack Rd, Flintstone, GA 30725 and is currently estimated at $287,601, approximately $204 per square foot. 251 N Nick A Jack Rd is a home located in Walker County with nearby schools including Chattanooga Valley Elementary School, Chattanooga Valley Middle School, and Ridgeland High School.
Ownership History
Date
Name
Owned For
Owner Type
Purchase Details
Closed on
Dec 31, 2001
Sold by
Brewer Billy R and Brewer Shirley F
Bought by
Williams David C and Williams Terri R
Current Estimated Value
Purchase Details
Closed on
Nov 30, 1995
Sold by
Cagle Glenda Sue
Bought by
Brewer Billy R and Brewer Shirley F
Purchase Details
Closed on
May 12, 1987
Sold by
Cagle Lonnie J and Cagle Glenda
Bought by
Cagle Glenda Sue
Purchase Details
Closed on
Aug 16, 1978
Sold by
Brown Harold B and Brown Rozanne L
Bought by
Cagle Lonnie J and Cagle Glenda
Purchase Details
Closed on
Apr 29, 1976
Sold by
Peters Jerry K and Peters Willa
Bought by
Brown Harold B and Brown Rozanne L
Purchase Details
Closed on
Jun 25, 1975
Sold by
Clements J W
Bought by
Peters Jerry K and Peters Willa
Purchase Details
Closed on
Jan 1, 1972
Bought by
Clements J W
Create a Home Valuation Report for This Property
The Home Valuation Report is an in-depth analysis detailing your home's value as well as a comparison with similar homes in the area
Home Values in the Area
Average Home Value in this Area
Purchase History
| Date | Buyer | Sale Price | Title Company |
|---|---|---|---|
| Williams David C | $94,000 | -- | |
| Brewer Billy R | $64,900 | -- | |
| Cagle Glenda Sue | -- | -- | |
| Cagle Lonnie J | -- | -- | |
| Brown Harold B | -- | -- | |
| Peters Jerry K | -- | -- | |
| Clements J W | -- | -- |
Source: Public Records
Tax History Compared to Growth
Tax History
| Year | Tax Paid | Tax Assessment Tax Assessment Total Assessment is a certain percentage of the fair market value that is determined by local assessors to be the total taxable value of land and additions on the property. | Land | Improvement |
|---|---|---|---|---|
| 2024 | $1,736 | $73,167 | $12,658 | $60,509 |
| 2023 | $1,703 | $70,136 | $12,658 | $57,478 |
| 2022 | $1,614 | $62,525 | $12,658 | $49,867 |
| 2021 | $1,405 | $48,530 | $7,673 | $40,857 |
| 2020 | $1,294 | $42,689 | $7,673 | $35,016 |
| 2019 | $1,316 | $42,689 | $7,673 | $35,016 |
| 2018 | $1,130 | $42,689 | $7,673 | $35,016 |
| 2017 | $1,434 | $42,689 | $7,673 | $35,016 |
| 2016 | $1,126 | $42,689 | $7,673 | $35,016 |
| 2015 | $1,435 | $52,112 | $8,088 | $44,024 |
| 2014 | $1,329 | $52,112 | $8,088 | $44,024 |
| 2013 | -- | $52,112 | $8,088 | $44,024 |
Source: Public Records
Map
Nearby Homes
- 304 John Thompson Rd
- 92 Nancy Ln
- 120 Williams Ave
- 19 Turkey Run
- 14 Turkey Run
- 58 Japonica St
- 16 Japonica St
- 244 Haven Hill
- 309 W Schmitt Rd
- 12 Mark Cir
- 404 W Schmitt Rd
- 757 W Schmitt Rd
- 54 Ferncliff Dr
- 1136 Ridgeland Rd
- 4766 Happy Valley Rd
- 52 Tower Dr
- 242 Cascade Dr
- 221 Highland Dr
- 2255 Nick-A Jack Rd
- 1308 Dry Valley Rd
- 203 N Nick A Jack Rd
- 189 N Nick A Jack Rd
- 189 Nickajack Rd N
- 476 John Thompson Rd
- 200 N Nick-A-jack Rd
- 220 N Nick-A-jack Rd
- 230 N Nick-A-jack Rd
- N N Nick-A-jack Rd
- 155 Nancy Ln
- 288 N Nick A Jack Rd
- 151 N Nick A Jack Rd
- 151 N Nickajack Rd
- 135 Nancy Ln
- 0 Turkey Run Unit 15 8413279
- 0 Fox Run Cir Unit 1118887
- 2763 Nickajack Rd
- 39 Fox Run Cir
- 0 Cloud Nine Ln Unit 1184708
- 0 Fox Run Cir Unit 6564
- 0 Fox Run Cir Unit 6561