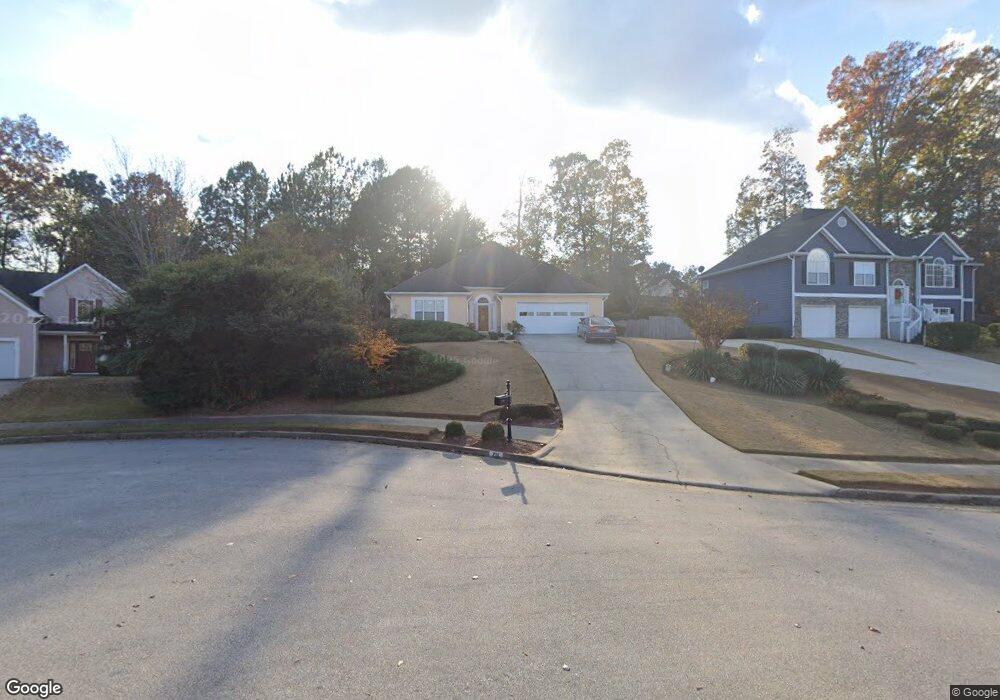
251 Reeves Creek Way Unit II Jonesboro, GA 30236
Estimated Value: $287,043 - $309,000
3
Beds
2
Baths
1,880
Sq Ft
$160/Sq Ft
Est. Value
About This Home
This home is located at 251 Reeves Creek Way Unit II, Jonesboro, GA 30236 and is currently estimated at $300,761, approximately $159 per square foot. 251 Reeves Creek Way Unit II is a home located in Henry County with nearby schools including Red Oak Elementary School, Dutchtown Middle School, and Dutchtown High School.
Ownership History
Date
Name
Owned For
Owner Type
Purchase Details
Closed on
Dec 13, 1999
Sold by
Pressnall Denise D and Pressnall Randy T
Bought by
Rouse Sophia W
Current Estimated Value
Home Financials for this Owner
Home Financials are based on the most recent Mortgage that was taken out on this home.
Original Mortgage
$144,301
Outstanding Balance
$52,673
Interest Rate
7.85%
Mortgage Type
FHA
Estimated Equity
$248,088
Purchase Details
Closed on
Jul 28, 1995
Sold by
Mcmillan Mcdona Ld Bldrs Inc
Bought by
Pressnall Denise D Randall T
Purchase Details
Closed on
Jan 6, 1995
Sold by
R Lanier Constr Co
Bought by
Mcdonald William
Home Financials for this Owner
Home Financials are based on the most recent Mortgage that was taken out on this home.
Original Mortgage
$112,805
Interest Rate
9.2%
Mortgage Type
Construction
Create a Home Valuation Report for This Property
The Home Valuation Report is an in-depth analysis detailing your home's value as well as a comparison with similar homes in the area
Home Values in the Area
Average Home Value in this Area
Purchase History
| Date | Buyer | Sale Price | Title Company |
|---|---|---|---|
| Rouse Sophia W | $144,400 | -- | |
| Pressnall Denise D Randall T | $130,900 | -- | |
| Mcdonald William | $22,000 | -- |
Source: Public Records
Mortgage History
| Date | Status | Borrower | Loan Amount |
|---|---|---|---|
| Open | Rouse Sophia W | $144,301 | |
| Previous Owner | Mcdonald William | $112,805 | |
| Closed | Pressnall Denise D Randall T | $0 |
Source: Public Records
Tax History Compared to Growth
Tax History
| Year | Tax Paid | Tax Assessment Tax Assessment Total Assessment is a certain percentage of the fair market value that is determined by local assessors to be the total taxable value of land and additions on the property. | Land | Improvement |
|---|---|---|---|---|
| 2025 | $1,367 | $114,760 | $16,000 | $98,760 |
| 2024 | $1,367 | $116,400 | $16,000 | $100,400 |
| 2023 | $1,141 | $122,160 | $14,000 | $108,160 |
| 2022 | $703 | $93,240 | $14,000 | $79,240 |
| 2021 | $703 | $74,160 | $14,000 | $60,160 |
| 2020 | $703 | $66,360 | $10,000 | $56,360 |
| 2019 | $703 | $64,560 | $10,000 | $54,560 |
| 2018 | $703 | $61,160 | $10,000 | $51,160 |
| 2016 | $637 | $53,200 | $10,000 | $43,200 |
| 2015 | $546 | $44,760 | $8,000 | $36,760 |
| 2014 | $438 | $37,360 | $6,000 | $31,360 |
Source: Public Records
Map
Nearby Homes
- 182 Spivey Glen Dr
- 224 Reeves Creek Way
- 1009 Chads Ridge
- 1137 Baileys Ct
- 617 Creekstone Ct
- 733 Berkeley Dr
- 732 Berkeley Dr
- 717 Berkeley Dr
- 706 Berkeley Dr
- 708 Berkeley Dr
- 725 Berkeley Dr
- 710 Berkeley Dr
- 745 Berkeley Dr
- 722 Berkeley Dr
- 718 Berkeley Dr
- 719 Berkeley Dr
- 712 Berkeley Dr
- 734 Berkeley Dr
- 702 Berkeley Dr
- Edmund 4 Bedroom Plan at Reeves Park
- 243 Reeves Creek Way
- 259 Reeves Creek Way
- 418 Woodwind Ct
- 426 Woodwind Ct
- 267 Reeves Creek Way
- 250 Reeves Creek Way
- 410 Woodwind Ct
- 258 Reeves Creek Way
- 178 Spivey Glen Dr
- 266 Reeves Creek Way
- 561 Creekstone Dr
- 557 Creekstone Dr
- 434 Woodwind Ct
- 242 Reeves Creek Way
- 172 Spivey Glen Dr
- 0 Woodwind Ct
- 232 Reeves Creek Way
- 562 Creekstone Dr
- 553 Creekstone Dr
- 442 Woodwind Ct