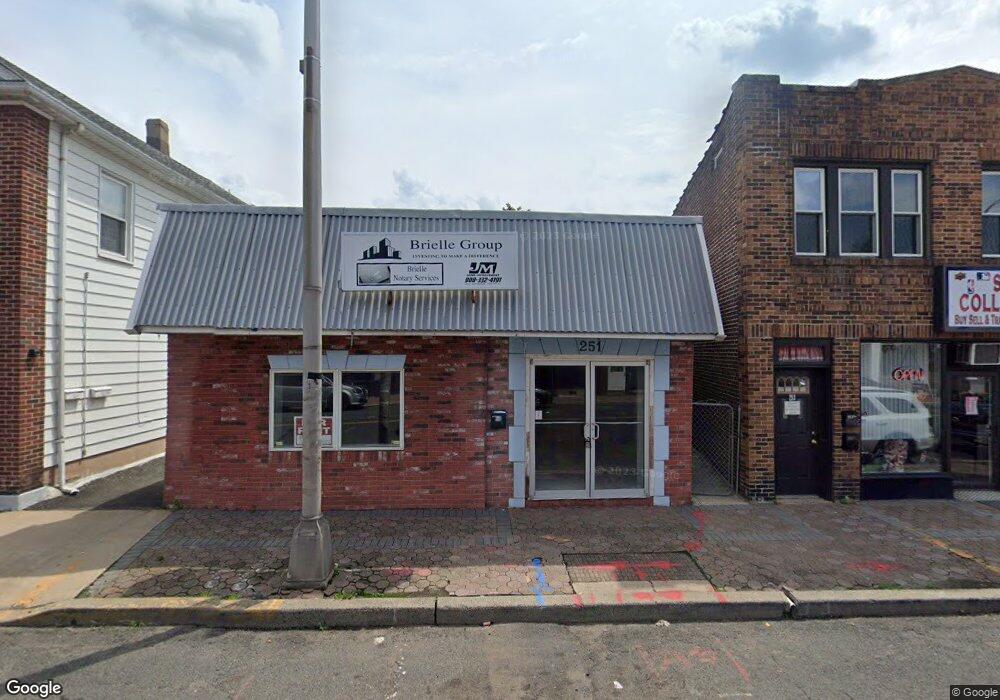
251 S Main St Unit Front Manville, NJ 08835
Estimated Value: $293,020
--
Bed
--
Bath
750
Sq Ft
$391/Sq Ft
Est. Value
About This Home
This home is located at 251 S Main St Unit Front, Manville, NJ 08835 and is currently priced at $293,020, approximately $390 per square foot. 251 S Main St Unit Front is a home located in Somerset County with nearby schools including Weston Elementary School, Roosevelt School, and Alexander Batcho Intermediate School (ABIS).
Ownership History
Date
Name
Owned For
Owner Type
Purchase Details
Closed on
Sep 10, 2024
Sold by
Somerset County Sheriff
Bought by
Ashmore Partners Llc
Current Estimated Value
Purchase Details
Closed on
Feb 11, 2020
Sold by
Pinter Steve
Bought by
Contor Group Llc
Home Financials for this Owner
Home Financials are based on the most recent Mortgage that was taken out on this home.
Original Mortgage
$294,972
Interest Rate
3.45%
Purchase Details
Closed on
Aug 28, 2014
Sold by
Czajkowski Andrzej and Czajkowski Thersa
Bought by
Pinter Steve
Purchase Details
Closed on
Apr 24, 2001
Sold by
Brazinsky John
Bought by
Czajkowski Andrzej and Czajkowski Theresa
Home Financials for this Owner
Home Financials are based on the most recent Mortgage that was taken out on this home.
Original Mortgage
$118,000
Interest Rate
7.09%
Mortgage Type
Commercial
Create a Home Valuation Report for This Property
The Home Valuation Report is an in-depth analysis detailing your home's value as well as a comparison with similar homes in the area
Home Values in the Area
Average Home Value in this Area
Purchase History
| Date | Buyer | Sale Price | Title Company |
|---|---|---|---|
| Ashmore Partners Llc | $1,000 | None Listed On Document | |
| Ashmore Partners Llc | $1,000 | None Listed On Document | |
| Contor Group Llc | $170,000 | -- | |
| Pinter Steve | $155,000 | Foundation Title Llc | |
| Czajkowski Andrzej | $148,500 | -- |
Source: Public Records
Mortgage History
| Date | Status | Borrower | Loan Amount |
|---|---|---|---|
| Previous Owner | Contor Group Llc | $294,972 | |
| Previous Owner | Contor Group Llc | -- | |
| Previous Owner | Czajkowski Andrzej | $118,000 |
Source: Public Records
Tax History Compared to Growth
Tax History
| Year | Tax Paid | Tax Assessment Tax Assessment Total Assessment is a certain percentage of the fair market value that is determined by local assessors to be the total taxable value of land and additions on the property. | Land | Improvement |
|---|---|---|---|---|
| 2025 | $4,795 | $260,000 | $72,800 | $187,200 |
| 2024 | $4,795 | $213,000 | $72,800 | $140,200 |
| 2023 | $3,640 | $151,400 | $72,800 | $78,600 |
| 2022 | $3,880 | $148,300 | $73,000 | $75,300 |
| 2021 | $4,873 | $164,800 | $73,000 | $91,800 |
| 2020 | $5,190 | $164,800 | $73,000 | $91,800 |
| 2019 | $5,221 | $159,800 | $73,000 | $86,800 |
| 2018 | $5,062 | $154,800 | $73,000 | $81,800 |
| 2017 | $4,975 | $154,800 | $73,000 | $81,800 |
| 2016 | $4,796 | $154,800 | $73,000 | $81,800 |
| 2015 | $5,574 | $230,600 | $82,000 | $148,600 |
| 2014 | -- | $230,600 | $82,000 | $148,600 |
Source: Public Records
Map
Nearby Homes
- 251 S Main St Unit 1
- 253 S Main St Unit 1
- 253 S Main St
- 249 S Main St Unit 555
- 249 S Main St
- 249 S Main St Unit 247
- 19 Beekman St
- 225 S Main St
- 243 S Main St
- 22 Rosalie St
- 275 S Main St
- 246 S Main St
- 246 S Main St
- 0 Beekman Unit 3690939
- 24 Rosalie St
- 244 S Main St
- 244 S Main St Unit 244
- 258 S Main St Unit D
- 258 S Main St
- 254 S Main St