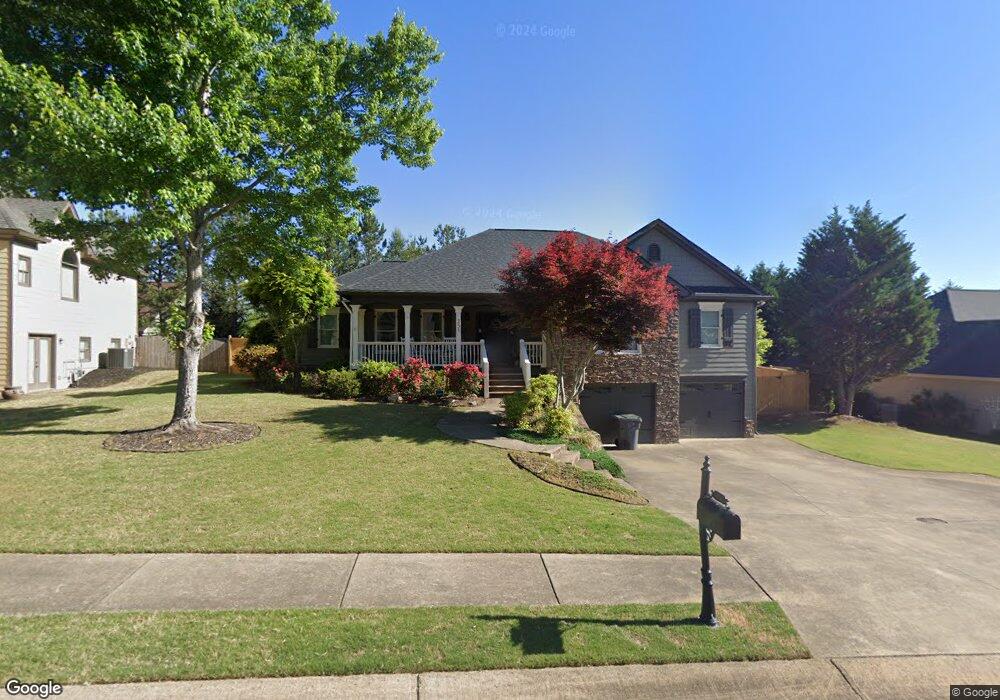
251 S Mountain Brook Way Unit 52 Ball Ground, GA 30107
Estimated Value: $442,000 - $454,319
3
Beds
2
Baths
1,768
Sq Ft
$253/Sq Ft
Est. Value
About This Home
This home is located at 251 S Mountain Brook Way Unit 52, Ball Ground, GA 30107 and is currently estimated at $448,160, approximately $253 per square foot. 251 S Mountain Brook Way Unit 52 is a home located in Cherokee County with nearby schools including Ball Ground Elementary School, Creekland Middle School, and Creekview High School.
Ownership History
Date
Name
Owned For
Owner Type
Purchase Details
Closed on
May 25, 2018
Sold by
Bayview Loan Servicing Llc
Bought by
Holmes Ryan
Current Estimated Value
Purchase Details
Closed on
Aug 24, 2015
Sold by
Gee David B
Bought by
Bayview Loan Servicing Llc
Purchase Details
Closed on
May 18, 2007
Sold by
Gee David B
Bought by
Gee David B and Gee Tiffany D
Home Financials for this Owner
Home Financials are based on the most recent Mortgage that was taken out on this home.
Original Mortgage
$229,818
Interest Rate
6.16%
Mortgage Type
FHA
Purchase Details
Closed on
May 17, 2007
Sold by
J A Burgess Builders Inc
Bought by
Gee David B
Home Financials for this Owner
Home Financials are based on the most recent Mortgage that was taken out on this home.
Original Mortgage
$229,818
Interest Rate
6.16%
Mortgage Type
FHA
Create a Home Valuation Report for This Property
The Home Valuation Report is an in-depth analysis detailing your home's value as well as a comparison with similar homes in the area
Home Values in the Area
Average Home Value in this Area
Purchase History
| Date | Buyer | Sale Price | Title Company |
|---|---|---|---|
| Holmes Ryan | $231,900 | -- | |
| Bayview Loan Servicing Llc | -- | -- | |
| Gee David B | -- | -- | |
| Gee David B | $233,500 | -- |
Source: Public Records
Mortgage History
| Date | Status | Borrower | Loan Amount |
|---|---|---|---|
| Previous Owner | Gee David B | $229,818 |
Source: Public Records
Tax History Compared to Growth
Tax History
| Year | Tax Paid | Tax Assessment Tax Assessment Total Assessment is a certain percentage of the fair market value that is determined by local assessors to be the total taxable value of land and additions on the property. | Land | Improvement |
|---|---|---|---|---|
| 2024 | $4,741 | $158,440 | $34,800 | $123,640 |
| 2023 | $4,696 | $156,920 | $30,800 | $126,120 |
| 2022 | $4,005 | $132,520 | $30,800 | $101,720 |
| 2021 | $3,340 | $101,160 | $22,400 | $78,760 |
| 2020 | $3,356 | $100,440 | $22,400 | $78,040 |
| 2019 | $3,128 | $94,440 | $20,400 | $74,040 |
| 2018 | $2,913 | $86,720 | $20,400 | $66,320 |
| 2017 | $2,607 | $198,300 | $16,000 | $63,320 |
| 2016 | $2,607 | $191,500 | $17,200 | $59,400 |
| 2015 | $2,669 | $193,200 | $17,200 | $60,080 |
| 2014 | $2,438 | $175,000 | $15,200 | $54,800 |
Source: Public Records
Map
Nearby Homes
- 210 S Mountain Brook Way
- 417 Tom Avery Dr
- 421 Tom Avery Dr
- 338 Reese Way
- 450 Tom Avery Dr
- 323 Reese Way
- 326 Reese Way
- 608 Madison Ct
- The Dillard Plan at Malone’s Pond
- The Evans Plan at Malone’s Pond
- The Vinings Plan at Malone’s Pond
- The Brooks Plan at Malone’s Pond
- The Bainbridge Plan at Malone’s Pond
- The Ashburn Plan at Malone’s Pond
- The Trenton Plan at Malone’s Pond
- The Desoto Plan at Malone’s Pond
- 553 Groover St
- 537 Groover St
- 533 Groover St
- 127 Mills Ln
- 251 S Mountain Brook Way
- 253 S Mountain Brook Way
- 249 S Mountain Brook Way
- 316 Taylor Leigh Ct
- S Mountain Brook
- 0 S Mountain Brooke Unit 3248625
- 257 S Mountain Brook Way
- 314 Taylor Leigh Ct
- 255 S Mountain Brook Way
- 247 S Mountain Brook Way
- 256 S Mountain Brook Way
- 254 S Mountain Brook Way
- 317 Taylor Leigh Ct
- 258 S Mountain Brook Way
- 252 S Mountain Brook Way
- 312 Taylor Leigh Ct
- 245 S Mountain Brook Way
- 259 S Mountain Brook Way
- 260 S Mountain Brook Way
- 250 S Mountain Brook Way