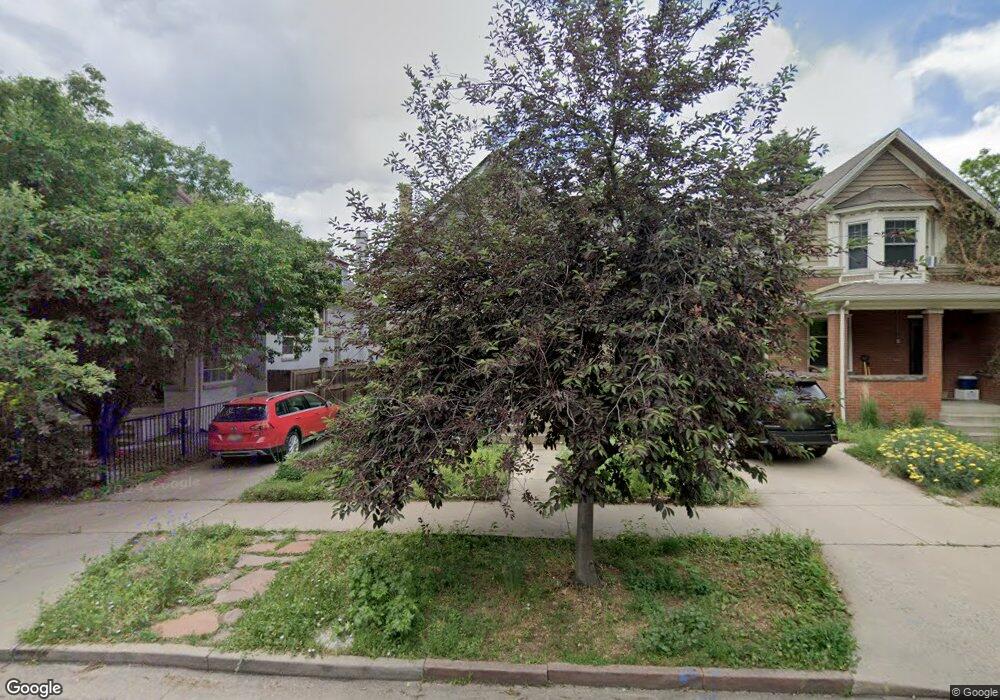
251 S Washington St Denver, CO 80209
Speer NeighborhoodEstimated Value: $778,000 - $969,000
3
Beds
2
Baths
1,716
Sq Ft
$519/Sq Ft
Est. Value
About This Home
This home is located at 251 S Washington St, Denver, CO 80209 and is currently estimated at $891,171, approximately $519 per square foot. 251 S Washington St is a home located in Denver County with nearby schools including Lincoln Elementary School, Grant Beacon Middle School, and South High School.
Ownership History
Date
Name
Owned For
Owner Type
Purchase Details
Closed on
Jul 23, 2002
Sold by
Mack Sandra A
Bought by
Rollman David A and Rollman Georgianne P
Current Estimated Value
Home Financials for this Owner
Home Financials are based on the most recent Mortgage that was taken out on this home.
Original Mortgage
$275,400
Outstanding Balance
$116,582
Interest Rate
6.69%
Estimated Equity
$774,589
Purchase Details
Closed on
Aug 15, 1997
Sold by
Stellor Gary E and Wallace Troy
Bought by
Mack Sandra A
Purchase Details
Closed on
Jan 6, 1997
Sold by
Putnam Armstrong Clara and Armstrong Charles E
Bought by
Stellor Gary E and Wallace Troy
Home Financials for this Owner
Home Financials are based on the most recent Mortgage that was taken out on this home.
Original Mortgage
$132,900
Interest Rate
7.75%
Mortgage Type
Seller Take Back
Purchase Details
Closed on
Oct 28, 1996
Sold by
Putnam Armstrong Clara and Armstrong Charles E
Bought by
The Charles E Armstrong Trust
Create a Home Valuation Report for This Property
The Home Valuation Report is an in-depth analysis detailing your home's value as well as a comparison with similar homes in the area
Home Values in the Area
Average Home Value in this Area
Purchase History
| Date | Buyer | Sale Price | Title Company |
|---|---|---|---|
| Rollman David A | $306,000 | Land Title Guarantee Company | |
| Mack Sandra A | $174,625 | -- | |
| Stellor Gary E | $139,900 | Land Title | |
| The Charles E Armstrong Trust | -- | -- |
Source: Public Records
Mortgage History
| Date | Status | Borrower | Loan Amount |
|---|---|---|---|
| Open | Rollman David A | $275,400 | |
| Previous Owner | Stellor Gary E | $132,900 |
Source: Public Records
Tax History Compared to Growth
Tax History
| Year | Tax Paid | Tax Assessment Tax Assessment Total Assessment is a certain percentage of the fair market value that is determined by local assessors to be the total taxable value of land and additions on the property. | Land | Improvement |
|---|---|---|---|---|
| 2024 | $4,029 | $57,570 | $20,340 | $37,230 |
| 2023 | $4,461 | $57,570 | $20,340 | $37,230 |
| 2022 | $3,883 | $48,830 | $24,920 | $23,910 |
| 2021 | $3,749 | $50,240 | $25,640 | $24,600 |
| 2020 | $3,311 | $44,620 | $17,630 | $26,990 |
| 2019 | $3,218 | $44,620 | $17,630 | $26,990 |
| 2018 | $3,297 | $42,620 | $16,140 | $26,480 |
| 2017 | $3,287 | $42,620 | $16,140 | $26,480 |
| 2016 | $3,396 | $41,640 | $16,055 | $25,585 |
| 2015 | $3,253 | $41,640 | $16,055 | $25,585 |
| 2014 | $2,912 | $35,060 | $6,344 | $28,716 |
Source: Public Records
Map
Nearby Homes
- 760 E Cedar Ave
- 236 S Clarkson St
- 232 S Pennsylvania St Unit 232
- 175 S Emerson St
- 155 S Pennsylvania St Unit 107
- 155 S Pennsylvania St Unit 209
- 100 S Clarkson St Unit 105
- 100 S Clarkson St Unit 202
- 148 S Emerson St Unit 203
- 165 S Ogden St
- 393 S Pennsylvania St
- 418 S Pearl St
- 431 E Bayaud Ave Unit 314
- 431 E Bayaud Ave Unit 304
- 444 S Pearl St
- 360 S Ogden St
- 65 S Emerson St
- 17 S Washington St
- 315 E Bayaud Ave
- 21 S Pennsylvania St Unit 1
- 245 S Washington St
- 257 S Washington St
- 263 S Washington St
- 235 S Washington St
- 233 S Washington St
- 233 S Washington St
- 225 S Washington St
- 225 S Washington St
- 244 S Washington St
- 269 S Washington St
- 252 S Washington St
- 217 S Washington St
- 254 S Pearl St
- 236 S Pearl St
- 215 S Washington St
- 230 S Washington St
- 250 S Pearl St
- 258 S Washington St
- 275 S Washington St
- 222 S Washington St