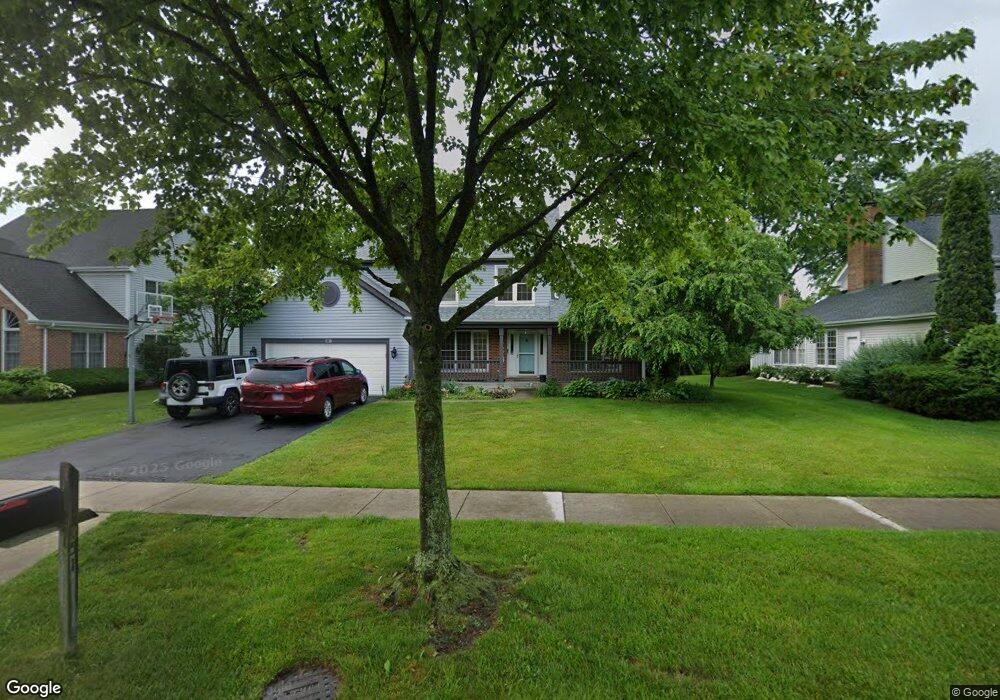
251 Stone Fence Rd Unit 1 Vernon Hills, IL 60061
Estimated Value: $726,265 - $813,000
4
Beds
4
Baths
2,362
Sq Ft
$320/Sq Ft
Est. Value
About This Home
This home is located at 251 Stone Fence Rd Unit 1, Vernon Hills, IL 60061 and is currently estimated at $756,566, approximately $320 per square foot. 251 Stone Fence Rd Unit 1 is a home located in Lake County with nearby schools including Laura B. Sprague School, Half Day School, and Daniel Wright Junior High School.
Ownership History
Date
Name
Owned For
Owner Type
Purchase Details
Closed on
Sep 25, 2011
Sold by
Li Maoqi and Xiong Michelle H
Bought by
Chelladurai Rajesh and Chelladurai Rajesh Karthini
Current Estimated Value
Home Financials for this Owner
Home Financials are based on the most recent Mortgage that was taken out on this home.
Original Mortgage
$382,500
Outstanding Balance
$262,385
Interest Rate
4.22%
Mortgage Type
New Conventional
Estimated Equity
$494,181
Purchase Details
Closed on
Jun 14, 2004
Sold by
Mcgeehin Kathryn T
Bought by
Li Maoqi and Xiong Michelle H
Home Financials for this Owner
Home Financials are based on the most recent Mortgage that was taken out on this home.
Original Mortgage
$380,000
Interest Rate
3.87%
Mortgage Type
Purchase Money Mortgage
Purchase Details
Closed on
Mar 29, 2001
Sold by
Mcgeehin Thomas J
Bought by
Mcgeehin Kathryn T
Create a Home Valuation Report for This Property
The Home Valuation Report is an in-depth analysis detailing your home's value as well as a comparison with similar homes in the area
Home Values in the Area
Average Home Value in this Area
Purchase History
| Date | Buyer | Sale Price | Title Company |
|---|---|---|---|
| Chelladurai Rajesh | $425,000 | Success Title Services Inc | |
| Li Maoqi | $510,000 | -- | |
| Mcgeehin Kathryn T | -- | -- |
Source: Public Records
Mortgage History
| Date | Status | Borrower | Loan Amount |
|---|---|---|---|
| Open | Chelladurai Rajesh | $382,500 | |
| Previous Owner | Li Maoqi | $380,000 |
Source: Public Records
Tax History Compared to Growth
Tax History
| Year | Tax Paid | Tax Assessment Tax Assessment Total Assessment is a certain percentage of the fair market value that is determined by local assessors to be the total taxable value of land and additions on the property. | Land | Improvement |
|---|---|---|---|---|
| 2024 | $16,680 | $196,081 | $41,169 | $154,912 |
| 2023 | $15,883 | $185,017 | $38,846 | $146,171 |
| 2022 | $15,883 | $177,210 | $37,207 | $140,003 |
| 2021 | $15,259 | $175,299 | $36,806 | $138,493 |
| 2020 | $14,871 | $175,897 | $36,932 | $138,965 |
| 2019 | $14,436 | $175,249 | $36,796 | $138,453 |
| 2018 | $14,853 | $184,781 | $36,365 | $148,416 |
| 2017 | $14,681 | $180,468 | $35,516 | $144,952 |
| 2016 | $14,103 | $172,812 | $34,009 | $138,803 |
| 2015 | $13,872 | $161,612 | $31,805 | $129,807 |
| 2014 | $11,831 | $139,010 | $34,159 | $104,851 |
| 2012 | $11,566 | $139,288 | $34,227 | $105,061 |
Source: Public Records
Map
Nearby Homes
- 124 Midway Ln
- 116 S Deerpath Dr
- 306 Lasalle St
- 339 Lasalle St
- 128 Lilly Ct
- 100 Lilly Ct
- 190 Southgate Dr
- 468 Woodland Chase Ln
- 361 Ashwood Ct Unit 75D
- 382 Birchwood Ct Unit 82C
- 384 Woodland Chase Ln
- 219 Abilene Ln
- 221 Alexandria Dr
- 399 Sislow Ln
- 410 Sislow Ln
- 15 Tanwood Ct Unit 52B
- 414 Sislow Ln
- 431 Woodland Chase Ln
- 336 Westwood Ct Unit 42D
- 14 Edgewood Rd
- 255 Stone Fence Rd
- 247 Stone Fence Rd
- 284 Hobble Bush Ln
- 261 Stone Fence Rd
- 278 Hobble Bush Ln
- 290 Hobble Bush Ln
- 227 White Fence Ct
- 234 White Fence Ct
- 296 Hobble Bush Ln
- 269 Stone Fence Rd
- 245 Barn Swallow Ln Unit 1
- 257 Barn Swallow Ln
- 215 White Fence Ct
- 222 Stone Fence Rd
- 246 Stone Fence Rd
- 271 Barn Swallow Ln
- 222 White Fence Ct
- 304 Hobble Bush Ln Unit 1
- 295 Hobble Bush Ln
- 303 Hobble Bush Ln