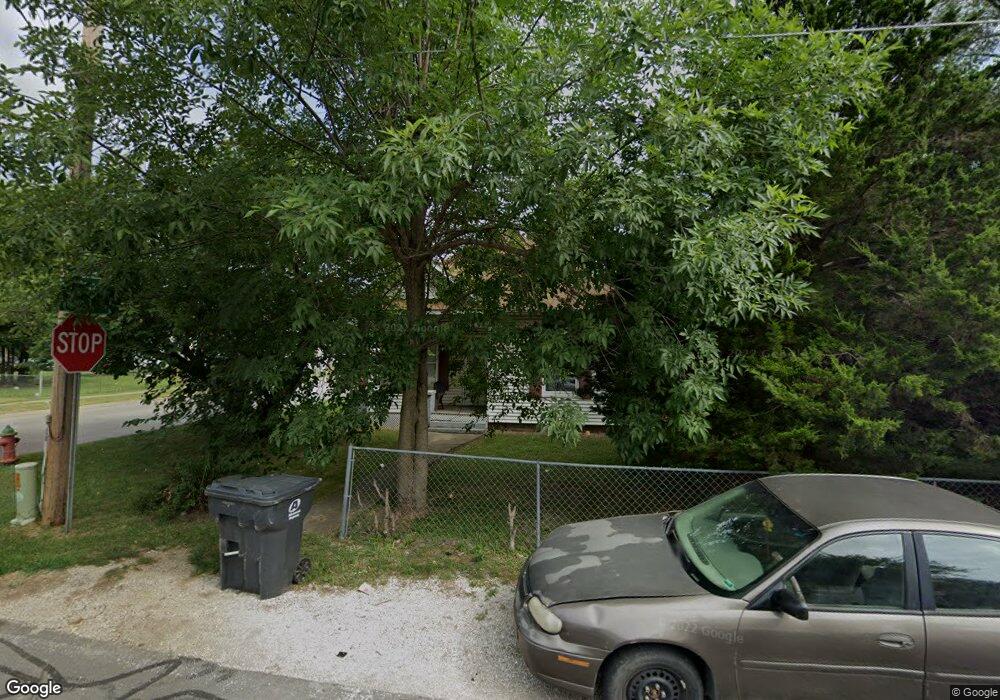
251 W Hinton Ave Moberly, MO 65270
Estimated Value: $57,000 - $75,000
2
Beds
2
Baths
1,024
Sq Ft
$62/Sq Ft
Est. Value
About This Home
This home is located at 251 W Hinton Ave, Moberly, MO 65270 and is currently estimated at $63,762, approximately $62 per square foot. 251 W Hinton Ave is a home located in Randolph County with nearby schools including Moberly Senior High School and St. Pius X. Catholic School.
Ownership History
Date
Name
Owned For
Owner Type
Purchase Details
Closed on
Oct 15, 2024
Sold by
Zenor Properties Llc
Bought by
Gilman Taylor
Current Estimated Value
Home Financials for this Owner
Home Financials are based on the most recent Mortgage that was taken out on this home.
Original Mortgage
$79,797
Outstanding Balance
$78,958
Interest Rate
6.35%
Mortgage Type
New Conventional
Estimated Equity
-$15,196
Purchase Details
Closed on
Jun 18, 2009
Sold by
Haley David and Haley Vicki
Bought by
Zenor Properties Llc
Home Financials for this Owner
Home Financials are based on the most recent Mortgage that was taken out on this home.
Original Mortgage
$40,500
Interest Rate
4.84%
Mortgage Type
Future Advance Clause Open End Mortgage
Purchase Details
Closed on
Mar 22, 2007
Sold by
Logson Rick
Bought by
Haley David
Purchase Details
Closed on
Feb 23, 2007
Sold by
All State Investment Corporation
Bought by
Logson Rick
Create a Home Valuation Report for This Property
The Home Valuation Report is an in-depth analysis detailing your home's value as well as a comparison with similar homes in the area
Home Values in the Area
Average Home Value in this Area
Purchase History
| Date | Buyer | Sale Price | Title Company |
|---|---|---|---|
| Gilman Taylor | -- | Town & Country Abstract | |
| Zenor Properties Llc | -- | -- | |
| Haley David | -- | -- | |
| Logson Rick | -- | -- |
Source: Public Records
Mortgage History
| Date | Status | Borrower | Loan Amount |
|---|---|---|---|
| Open | Gilman Taylor | $79,797 | |
| Previous Owner | Zenor Properties Llc | $40,500 |
Source: Public Records
Tax History Compared to Growth
Tax History
| Year | Tax Paid | Tax Assessment Tax Assessment Total Assessment is a certain percentage of the fair market value that is determined by local assessors to be the total taxable value of land and additions on the property. | Land | Improvement |
|---|---|---|---|---|
| 2025 | $254 | $3,790 | $650 | $3,140 |
| 2024 | $254 | $3,490 | $570 | $2,920 |
| 2023 | $258 | $3,490 | $570 | $2,920 |
| 2022 | $241 | $3,350 | $570 | $2,780 |
| 2021 | $240 | $3,350 | $570 | $2,780 |
| 2020 | $240 | $3,330 | $569 | $2,761 |
| 2019 | $239 | $3,330 | $569 | $2,761 |
| 2018 | $238 | $3,330 | $569 | $2,761 |
| 2017 | $207 | $3,320 | $0 | $0 |
| 2016 | $207 | $2,920 | $0 | $0 |
| 2014 | -- | $2,730 | $0 | $0 |
| 2013 | -- | $2,730 | $0 | $0 |
| 2012 | -- | $2,750 | $0 | $0 |
Source: Public Records
Map
Nearby Homes
- 219 W Hinton Ave
- 303 W Hinton Ave
- 215 W Hinton Ave
- 248 W Hinton Ave
- 250 W Hinton Ave
- 224 W Hinton Ave
- 210 W Hinton Ave
- 214 W Hinton Ave
- 302 W Hinton Ave
- 306 W Hinton Ave
- 313 W Hinton Ave
- 310 W Hinton Ave
- 221 Collins Ave
- 0 W Hinton Ave
- 1212 W Highway 24
- 217 Collins Ave
- 301 Collins Ave
- 213 Collins Ave
- 305 N Hinkley St
- 315 W Hinton Ave