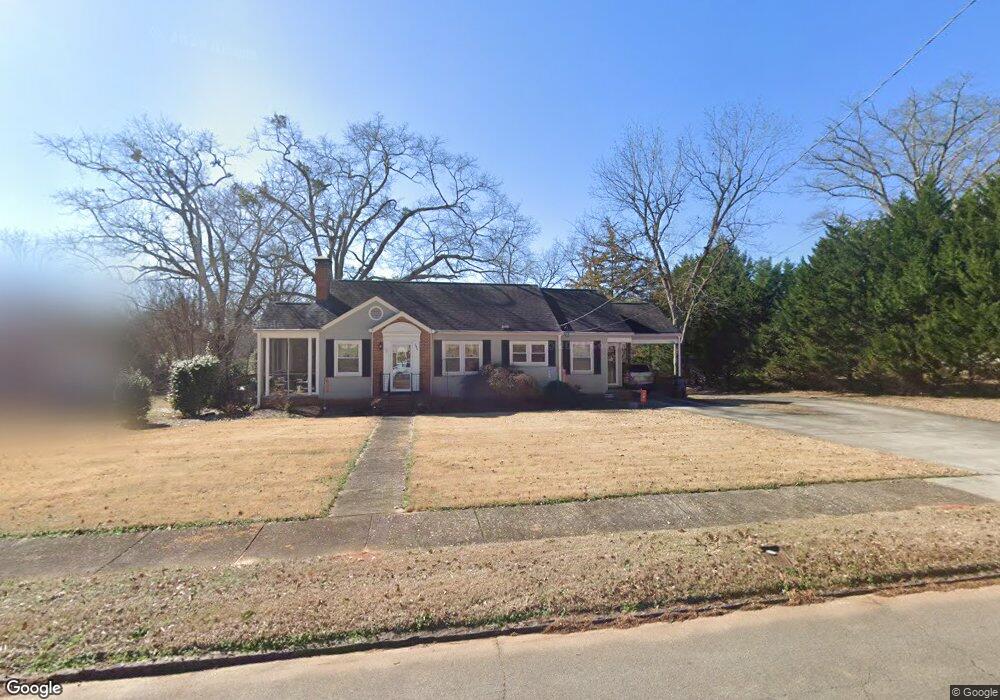
251 W Main St Rutledge, GA 30663
Estimated Value: $289,000 - $400,000
3
Beds
2
Baths
1,269
Sq Ft
$279/Sq Ft
Est. Value
About This Home
This home is located at 251 W Main St, Rutledge, GA 30663 and is currently estimated at $353,760, approximately $278 per square foot. 251 W Main St is a home located in Morgan County with nearby schools including Morgan County Primary School, Morgan County Elementary School, and Morgan County Middle School.
Ownership History
Date
Name
Owned For
Owner Type
Purchase Details
Closed on
Feb 26, 2021
Sold by
Shropshire David
Bought by
Shropshire Kathryn
Current Estimated Value
Home Financials for this Owner
Home Financials are based on the most recent Mortgage that was taken out on this home.
Original Mortgage
$194,600
Outstanding Balance
$173,252
Interest Rate
2.7%
Mortgage Type
New Conventional
Estimated Equity
$180,508
Purchase Details
Closed on
Aug 17, 2018
Sold by
Jackson Rodney
Bought by
Shropshire Kathryn and Shropshire David
Home Financials for this Owner
Home Financials are based on the most recent Mortgage that was taken out on this home.
Original Mortgage
$194,750
Interest Rate
4.5%
Mortgage Type
New Conventional
Purchase Details
Closed on
Oct 11, 2005
Sold by
Howe Robert R
Bought by
Jackson Rodney
Purchase Details
Closed on
Dec 17, 2003
Sold by
Howe Robert R
Bought by
Howe Robert R and Howe
Purchase Details
Closed on
Dec 31, 2001
Sold by
Whitaker Mr Horace
Bought by
Lanier Richard W
Purchase Details
Closed on
Apr 27, 1948
Sold by
Davis Day
Bought by
Whitaker Mr Horace
Create a Home Valuation Report for This Property
The Home Valuation Report is an in-depth analysis detailing your home's value as well as a comparison with similar homes in the area
Home Values in the Area
Average Home Value in this Area
Purchase History
| Date | Buyer | Sale Price | Title Company |
|---|---|---|---|
| Shropshire Kathryn | -- | -- | |
| Shropshire Kathryn | $210,000 | -- | |
| Jackson Rodney | -- | -- | |
| Jackson Rodney | $150,000 | -- | |
| Howe Robert R | -- | -- | |
| Howe Robert R | $130,000 | -- | |
| Lanier Richard W | $80,000 | -- | |
| Whitaker Mr Horace | $600 | -- |
Source: Public Records
Mortgage History
| Date | Status | Borrower | Loan Amount |
|---|---|---|---|
| Open | Shropshire Kathryn | $194,600 | |
| Previous Owner | Shropshire Kathryn | $194,750 |
Source: Public Records
Tax History Compared to Growth
Tax History
| Year | Tax Paid | Tax Assessment Tax Assessment Total Assessment is a certain percentage of the fair market value that is determined by local assessors to be the total taxable value of land and additions on the property. | Land | Improvement |
|---|---|---|---|---|
| 2025 | $2,796 | $122,015 | $15,200 | $106,815 |
| 2024 | $2,752 | $108,412 | $15,200 | $93,212 |
| 2023 | $2,554 | $97,766 | $13,600 | $84,166 |
| 2022 | $2,534 | $93,387 | $13,600 | $79,787 |
| 2021 | $2,290 | $84,225 | $8,000 | $76,225 |
| 2020 | $2,257 | $82,225 | $6,000 | $76,225 |
| 2019 | $2,291 | $82,202 | $6,000 | $76,202 |
| 2018 | $2,363 | $81,803 | $6,000 | $75,803 |
| 2017 | $2,380 | $81,197 | $6,000 | $75,197 |
| 2016 | $2,179 | $72,392 | $6,000 | $66,392 |
| 2015 | $2,158 | $70,680 | $4,000 | $66,680 |
| 2014 | $1,553 | $52,120 | $4,000 | $48,120 |
| 2013 | -- | $41,040 | $4,000 | $37,040 |
Source: Public Records
Map
Nearby Homes
- 120 Hidden Falls Ct
- 224 Hollis St
- 0 Hawkins Academy Rd Unit 10561655
- 0 Fairplay St Unit 10637174
- 5761 W Dixie Hwy
- 5521 Atlanta Hwy
- 294 Tuscany Dr
- 5841 Atlanta Hwy
- 0 Reese Rd Unit 10622381
- 0 Reese Rd Unit 25651133
- 0 W Dixie Hwy Unit 10499573
- 1151 Fears Rd
- 5187 Parkview Rd
- 25 Browning Shoals Rd
- 745 Amber Lakes Ct Unit 2
- 3641 Davis Academy Rd
- 2535 Willow Ln
- 1310 Knox Chapel Rd
- 1550 Knox Chapel Rd
- 00 Fears Rd