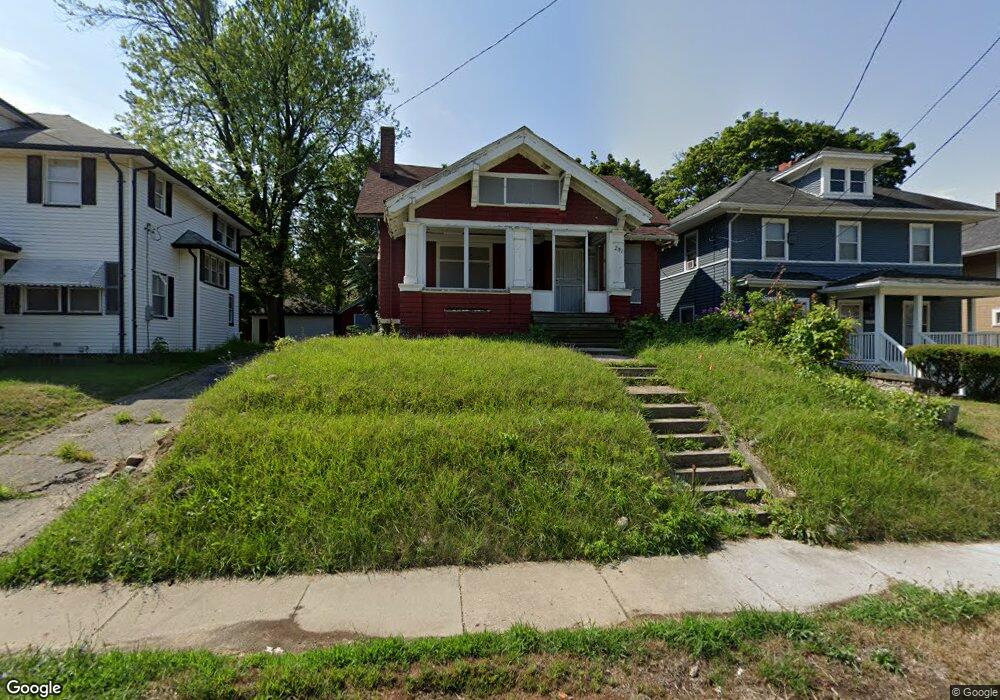
251 W Pike St Pontiac, MI 48341
Estimated Value: $40,000 - $247,000
4
Beds
1
Bath
1,811
Sq Ft
$86/Sq Ft
Est. Value
About This Home
This home is located at 251 W Pike St, Pontiac, MI 48341 and is currently estimated at $155,333, approximately $85 per square foot. 251 W Pike St is a home located in Oakland County with nearby schools including Walt Whitman Elementary School, Pontiac Middle School, and Pontiac High School.
Ownership History
Date
Name
Owned For
Owner Type
Purchase Details
Closed on
Aug 29, 2012
Sold by
Oakland County Treasurer
Bought by
Sargent Willie
Current Estimated Value
Purchase Details
Closed on
Apr 7, 2005
Sold by
Jefferson Hosie
Bought by
Jefferson Hosie and Jefferson Earl N
Home Financials for this Owner
Home Financials are based on the most recent Mortgage that was taken out on this home.
Original Mortgage
$85,000
Interest Rate
5.75%
Mortgage Type
Stand Alone Refi Refinance Of Original Loan
Purchase Details
Closed on
Mar 1, 2005
Sold by
Jefferson Earl N and Jefferson Paula
Bought by
Jefferson Earl N and Westbrooke Alice Faye
Home Financials for this Owner
Home Financials are based on the most recent Mortgage that was taken out on this home.
Original Mortgage
$85,000
Interest Rate
5.75%
Mortgage Type
Stand Alone Refi Refinance Of Original Loan
Purchase Details
Closed on
Oct 1, 2001
Sold by
Jefferson Hosie
Bought by
Jefferson Earl N
Create a Home Valuation Report for This Property
The Home Valuation Report is an in-depth analysis detailing your home's value as well as a comparison with similar homes in the area
Home Values in the Area
Average Home Value in this Area
Purchase History
| Date | Buyer | Sale Price | Title Company |
|---|---|---|---|
| Sargent Willie | $10,754 | None Available | |
| Jefferson Hosie | -- | Fatco | |
| Jefferson Hosie | -- | Fatco | |
| Jefferson Earl N | -- | Fatco | |
| Jefferson Earl N | -- | -- |
Source: Public Records
Mortgage History
| Date | Status | Borrower | Loan Amount |
|---|---|---|---|
| Previous Owner | Jefferson Earl N | $85,000 |
Source: Public Records
Tax History Compared to Growth
Tax History
| Year | Tax Paid | Tax Assessment Tax Assessment Total Assessment is a certain percentage of the fair market value that is determined by local assessors to be the total taxable value of land and additions on the property. | Land | Improvement |
|---|---|---|---|---|
| 2024 | $73 | $4,050 | $0 | $0 |
| 2023 | $70 | $4,760 | $0 | $0 |
| 2022 | $130 | $4,330 | $0 | $0 |
| 2021 | $129 | $2,340 | $0 | $0 |
| 2020 | $64 | $1,800 | $0 | $0 |
| 2019 | $881 | $23,160 | $0 | $0 |
| 2018 | $845 | $20,430 | $0 | $0 |
| 2017 | $812 | $19,240 | $0 | $0 |
| 2016 | $837 | $17,490 | $0 | $0 |
| 2015 | -- | $15,210 | $0 | $0 |
| 2014 | -- | $13,800 | $0 | $0 |
| 2011 | -- | $21,220 | $0 | $0 |
Source: Public Records
Map
Nearby Homes
- 363 W Huron St
- 28 Stout St
- 118 Henry Clay Ave
- 124 Henry Clay Ave
- 20 Stout St
- 50 Henderson St
- 72 Norton St
- 73 Henderson St
- 22 Cooley St
- 45 Lake St
- 39 Portage St
- 44 Lake St
- 35 Liberty St
- 205 Florence St
- 69 Lincoln St
- 88 Thorpe St
- 27 Elizabeth Lake Rd
- 0 Woodward Ave
- 48 Florence St
- 0 Baldwin Rd Unit 20251027987
- 245 W Pike St
- 239 W Pike St
- 255 W Pike St
- 58 Lorraine Ct
- 261 W Pike St
- 54 Lorraine Ct
- 64 Lorraine Ct
- 68 Lorraine Ct Unit Bldg-Unit
- 68 Lorraine Ct
- 44 Lorraine Ct
- 233 W Pike St
- 40 Lorraine Ct
- 71 Franklin Blvd
- 227 W Pike St
- 59 Lorraine Ct
- 268 W Pike St
- 63 Lorraine Ct
- 34 Lorraine Ct
- 67 Lorraine Ct
- 221 W Pike St Unit 1 4