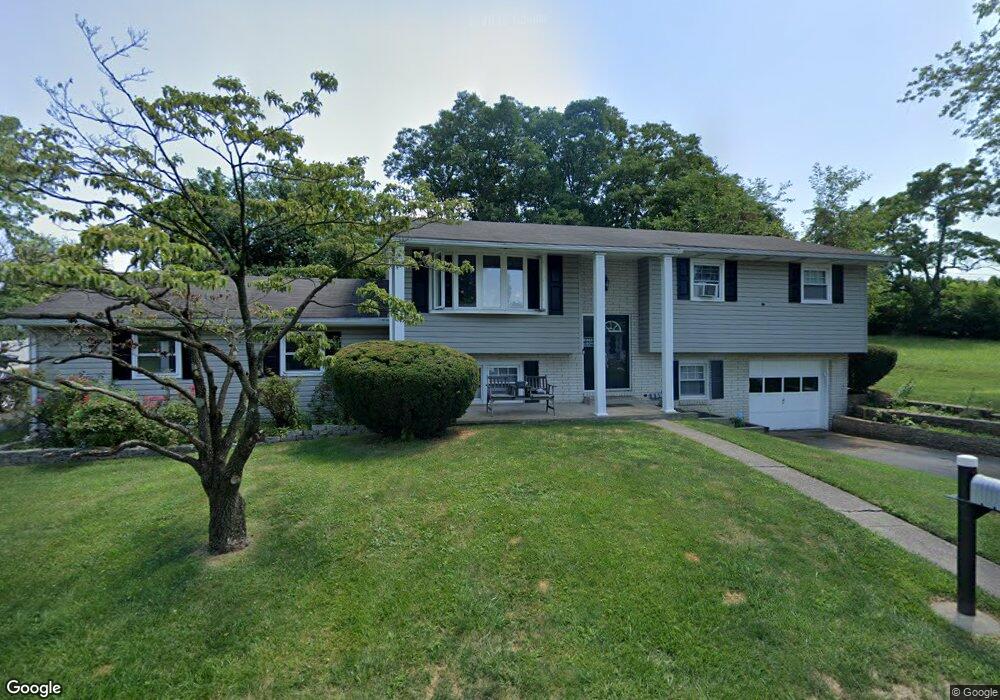
2510 6th St Bethlehem, PA 18020
Middletown NeighborhoodEstimated Value: $376,891 - $436,000
3
Beds
1
Bath
1,726
Sq Ft
$242/Sq Ft
Est. Value
About This Home
This home is located at 2510 6th St, Bethlehem, PA 18020 and is currently estimated at $417,973, approximately $242 per square foot. 2510 6th St is a home located in Northampton County with nearby schools including East Hills Middle School, Freedom High School, and Bethlehem Christian School.
Ownership History
Date
Name
Owned For
Owner Type
Purchase Details
Closed on
Oct 31, 2006
Sold by
Wilson Steve W
Bought by
Quirk Michael P
Current Estimated Value
Home Financials for this Owner
Home Financials are based on the most recent Mortgage that was taken out on this home.
Original Mortgage
$290,000
Outstanding Balance
$168,627
Interest Rate
6.47%
Mortgage Type
New Conventional
Estimated Equity
$249,346
Create a Home Valuation Report for This Property
The Home Valuation Report is an in-depth analysis detailing your home's value as well as a comparison with similar homes in the area
Home Values in the Area
Average Home Value in this Area
Purchase History
| Date | Buyer | Sale Price | Title Company |
|---|---|---|---|
| Quirk Michael P | $290,000 | -- |
Source: Public Records
Mortgage History
| Date | Status | Borrower | Loan Amount |
|---|---|---|---|
| Open | Quirk Michael P | $290,000 |
Source: Public Records
Tax History
| Year | Tax Paid | Tax Assessment Tax Assessment Total Assessment is a certain percentage of the fair market value that is determined by local assessors to be the total taxable value of land and additions on the property. | Land | Improvement |
|---|---|---|---|---|
| 2026 | $702 | $65,000 | $21,100 | $43,900 |
| 2025 | $702 | $65,000 | $21,100 | $43,900 |
| 2024 | $4,988 | $65,000 | $21,100 | $43,900 |
| 2023 | $5,004 | $65,000 | $21,100 | $43,900 |
| 2022 | $4,960 | $65,000 | $21,100 | $43,900 |
| 2021 | $4,921 | $65,000 | $21,100 | $43,900 |
| 2020 | $4,927 | $65,000 | $21,100 | $43,900 |
| 2019 | $4,908 | $65,000 | $21,100 | $43,900 |
| 2018 | $4,774 | $65,000 | $21,100 | $43,900 |
| 2017 | $4,741 | $65,000 | $21,100 | $43,900 |
| 2016 | -- | $65,000 | $21,100 | $43,900 |
| 2015 | -- | $65,000 | $21,100 | $43,900 |
| 2014 | -- | $65,000 | $21,100 | $43,900 |
Source: Public Records
Map
Nearby Homes
- 2406 6th St
- 3285 Lime St
- 3331 Walnut St
- 3902 Orth St
- 4000 Carter Rd
- 2145 15th St
- 3951 Trythall St
- 3023 Middletown Rd
- 1712 9th St
- 2850 Jefferson St
- 4141 Walter Rd
- 4008 Donegal Dr
- 4006 Easton Ave
- 3326 Lehigh St
- 3560 Moravian Ct
- 1502 2nd St
- 2524 East Blvd
- 1410 Quarry Dr
- 2152 East Blvd
- 1510 Covington Place
Your Personal Tour Guide
Ask me questions while you tour the home.