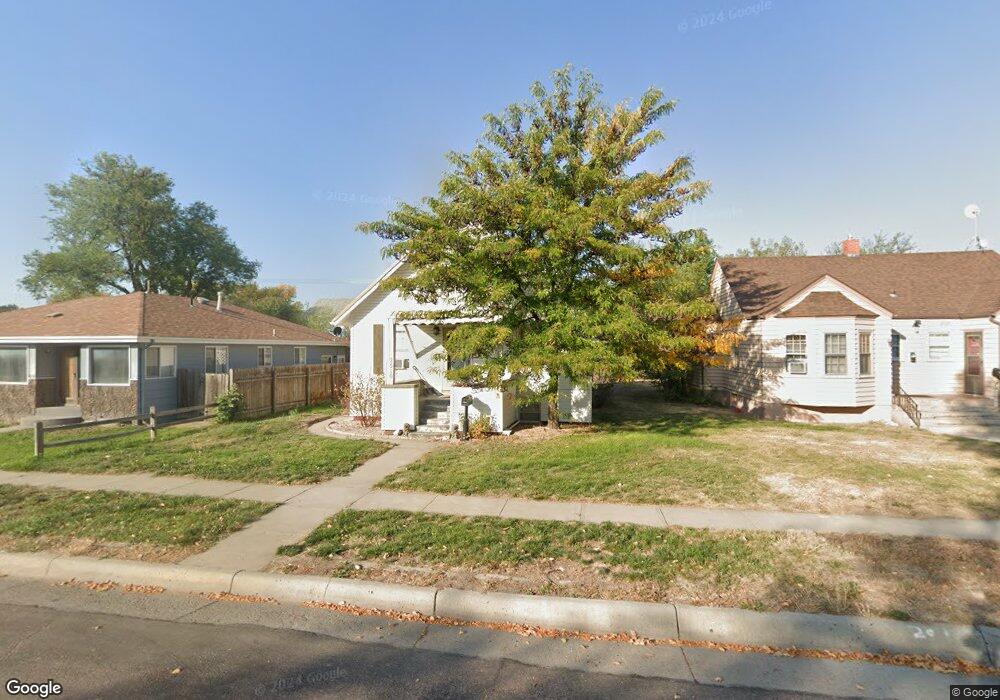
2510 E A St Torrington, WY 82240
Estimated Value: $147,000 - $221,000
4
Beds
3
Baths
2,324
Sq Ft
$84/Sq Ft
Est. Value
About This Home
This home is located at 2510 E A St, Torrington, WY 82240 and is currently estimated at $195,543, approximately $84 per square foot. 2510 E A St is a home located in Goshen County with nearby schools including Lincoln Elementary School, Trail Elementary School, and Torrington Middle School.
Ownership History
Date
Name
Owned For
Owner Type
Purchase Details
Closed on
Jul 11, 2019
Sold by
Home Point Financial Corp
Bought by
Decker Noah and Decker Caitlin
Current Estimated Value
Purchase Details
Closed on
Nov 20, 2018
Sold by
Goshen County Sheriff
Bought by
Home Point Financial Corp
Purchase Details
Closed on
Aug 8, 2014
Sold by
Hansen Dempsey D and Hansen Sarita S
Bought by
Potter Chase L
Home Financials for this Owner
Home Financials are based on the most recent Mortgage that was taken out on this home.
Original Mortgage
$89,743
Interest Rate
4.19%
Mortgage Type
New Conventional
Purchase Details
Closed on
Mar 8, 2012
Sold by
Stoeger William L and Stoeger Helen C
Bought by
Hansen Dempsey D and Hansen Sarita S
Home Financials for this Owner
Home Financials are based on the most recent Mortgage that was taken out on this home.
Original Mortgage
$52,000
Interest Rate
3.9%
Purchase Details
Closed on
Jul 28, 2008
Sold by
Stoeger William L and Stoeger Helen C
Bought by
Sundby Oliver M
Create a Home Valuation Report for This Property
The Home Valuation Report is an in-depth analysis detailing your home's value as well as a comparison with similar homes in the area
Home Values in the Area
Average Home Value in this Area
Purchase History
| Date | Buyer | Sale Price | Title Company |
|---|---|---|---|
| Decker Noah | -- | None Available | |
| Home Point Financial Corp | -- | None Available | |
| Potter Chase L | -- | -- | |
| Hansen Dempsey D | -- | -- | |
| Sundby Oliver M | -- | -- |
Source: Public Records
Mortgage History
| Date | Status | Borrower | Loan Amount |
|---|---|---|---|
| Previous Owner | Potter Chase L | $89,743 | |
| Previous Owner | Hansen Dempsey D | $52,000 |
Source: Public Records
Tax History
| Year | Tax Paid | Tax Assessment Tax Assessment Total Assessment is a certain percentage of the fair market value that is determined by local assessors to be the total taxable value of land and additions on the property. | Land | Improvement |
|---|---|---|---|---|
| 2025 | $804 | $8,283 | $1,233 | $7,050 |
| 2024 | $804 | $10,678 | $1,644 | $9,034 |
| 2023 | $778 | $10,338 | $1,651 | $8,687 |
| 2022 | $733 | $9,734 | $1,651 | $8,083 |
| 2021 | $635 | $8,435 | $1,739 | $6,696 |
| 2020 | $594 | $7,885 | $1,597 | $6,288 |
| 2019 | $744 | $9,882 | $1,573 | $8,309 |
| 2018 | $714 | $9,487 | $1,564 | $7,923 |
| 2017 | $717 | $9,517 | $1,549 | $7,968 |
| 2016 | $687 | $9,129 | $1,569 | $7,560 |
| 2015 | -- | $8,627 | $1,569 | $7,058 |
| 2014 | -- | $10,362 | $1,278 | $9,084 |
Source: Public Records
Map
Nearby Homes
- 2510 E A St Unit 25th
- 2502 E A St
- 2518 E A St
- 2509 E A St
- 2501 E A St
- 120 E 25th Ave
- 120 E 25th Ave Unit East A Street
- 2442 E A St
- 2526 E A St
- 2517 E A St
- 2441 E A St
- 2434 E A St
- 2525 E A St
- 215 E 25th Ave
- 2534 E A St
- 2433 E A St
- 2433 E A St Unit 24th Street
- 2533 E A St
- 2426 E A St
- 2426 E A St Unit 24th
Your Personal Tour Guide
Ask me questions while you tour the home.