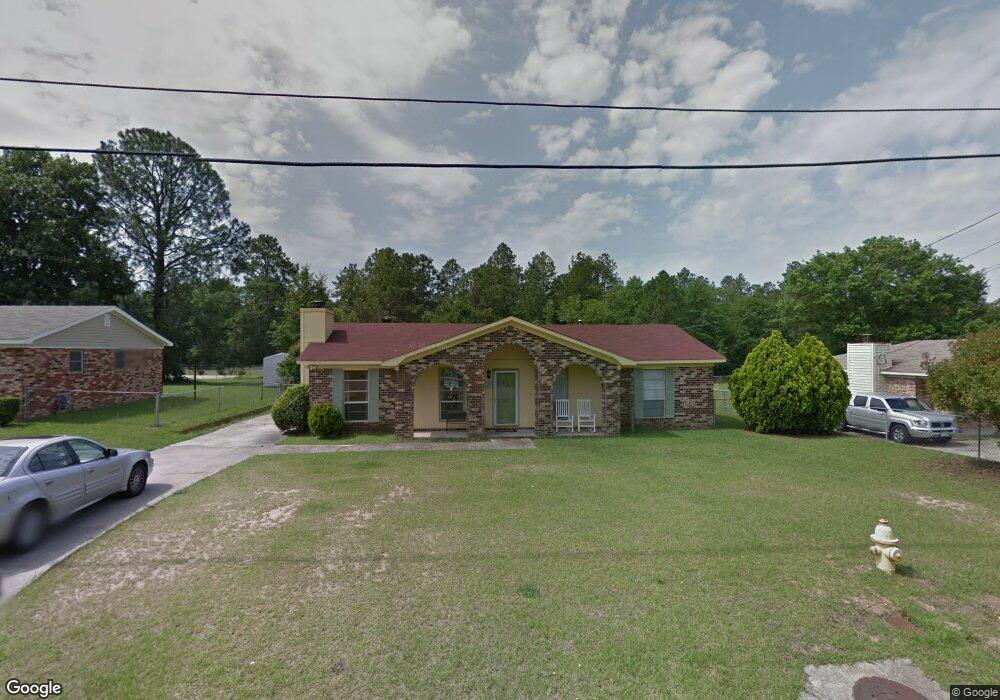
2510 Fieldcrest Dr S Hephzibah, GA 30815
Jamestown NeighborhoodEstimated Value: $173,825 - $183,000
4
Beds
2
Baths
1,377
Sq Ft
$129/Sq Ft
Est. Value
About This Home
This home is located at 2510 Fieldcrest Dr S, Hephzibah, GA 30815 and is currently estimated at $177,956, approximately $129 per square foot. 2510 Fieldcrest Dr S is a home located in Richmond County with nearby schools including Diamond Lakes Elementary School, Pine Hill Middle School, and Johnson Magnet.
Ownership History
Date
Name
Owned For
Owner Type
Purchase Details
Closed on
Dec 15, 2006
Sold by
Murray James C and Cowart Lyssa B
Bought by
Harris Shirley P
Current Estimated Value
Home Financials for this Owner
Home Financials are based on the most recent Mortgage that was taken out on this home.
Original Mortgage
$71,900
Outstanding Balance
$42,169
Interest Rate
6.06%
Mortgage Type
Purchase Money Mortgage
Estimated Equity
$135,787
Purchase Details
Closed on
Jun 3, 2005
Sold by
Moore Ok Chi
Bought by
Murray James C and Cowart Lyssa B
Home Financials for this Owner
Home Financials are based on the most recent Mortgage that was taken out on this home.
Original Mortgage
$80,142
Interest Rate
5.74%
Mortgage Type
FHA
Purchase Details
Closed on
Jul 26, 1990
Sold by
Bang Un K Bang Sung K
Bought by
Moore Ok Chi
Purchase Details
Closed on
Jun 1, 1986
Sold by
Nale Michael A Nale Sun Ok
Bought by
Bang Sung Kyu Bang Un Kyong
Create a Home Valuation Report for This Property
The Home Valuation Report is an in-depth analysis detailing your home's value as well as a comparison with similar homes in the area
Home Values in the Area
Average Home Value in this Area
Purchase History
| Date | Buyer | Sale Price | Title Company |
|---|---|---|---|
| Harris Shirley P | $89,900 | None Available | |
| Murray James C | $81,400 | -- | |
| Moore Ok Chi | $50,900 | -- | |
| Bang Sung Kyu Bang Un Kyong | $47,700 | -- |
Source: Public Records
Mortgage History
| Date | Status | Borrower | Loan Amount |
|---|---|---|---|
| Open | Harris Shirley P | $71,900 | |
| Closed | Harris Shirley P | $13,500 | |
| Previous Owner | Murray James C | $80,142 |
Source: Public Records
Tax History Compared to Growth
Tax History
| Year | Tax Paid | Tax Assessment Tax Assessment Total Assessment is a certain percentage of the fair market value that is determined by local assessors to be the total taxable value of land and additions on the property. | Land | Improvement |
|---|---|---|---|---|
| 2025 | $972 | $66,704 | $7,200 | $59,504 |
| 2024 | $972 | $61,480 | $7,200 | $54,280 |
| 2023 | $1,221 | $55,472 | $7,200 | $48,272 |
| 2022 | $1,452 | $42,713 | $7,200 | $35,513 |
| 2021 | $1,226 | $32,010 | $7,200 | $24,810 |
| 2020 | $1,210 | $32,010 | $7,200 | $24,810 |
| 2019 | $1,269 | $32,010 | $7,200 | $24,810 |
| 2018 | $1,277 | $32,010 | $7,200 | $24,810 |
| 2017 | $1,234 | $31,903 | $7,200 | $24,703 |
| 2016 | $1,235 | $31,903 | $7,200 | $24,703 |
| 2015 | $1,242 | $31,903 | $7,200 | $24,703 |
| 2014 | $1,239 | $31,768 | $7,200 | $24,568 |
Source: Public Records
Map
Nearby Homes
- 2348 Fieldcrest Dr S
- 4309 Windsor Spring Rd
- 212 Willowton Ln
- 210 Willowton Ln
- 208 Willowton Ln
- 206 Willowton Ln
- 2806 Wyndham Dr
- 4212 Cap Chat St
- 1018 Rosendale Dr
- 1016 Rosendale Dr
- 1012 Rosendale Dr
- 2711 Ashton Dr
- 2603 Ardwick Dr
- 2676 Ashton Dr
- 4428 T J Kelly Dr
- 3371 Stockport Dr
- 3359 Stockport Dr
- 3351 Stockport Dr
- 3363 Stockport Dr
- 3367 Stockport Dr
- 2510 Fieldcrest Dr S
- 2509 S Fieldcrest Dr
- 2508 Fieldcrest Dr S
- 2508S Fieldcrest Dr S
- 2512S Fieldcrest Dr S
- 2518 S Fieldcrest Dr
- 2514 Fieldcrest Dr S
- 2506 Fieldcrest Dr S
- 2514S Fieldcrest Dr S
- 2505 Fieldcrest Dr S
- 4235 Cap Chat St
- 2509S Fieldcrest Dr S
- 2502 Fieldcrest Dr S
- 2504S Fieldcrest Dr S
- 4234 Cap Chat St
- 2503S Fieldcrest Dr S
- 4233 Cap Chat St
- 2513 Fieldcrest Dr S
- 2520 Fieldcrest Dr S
- 2304 Fieldcrest Dr S