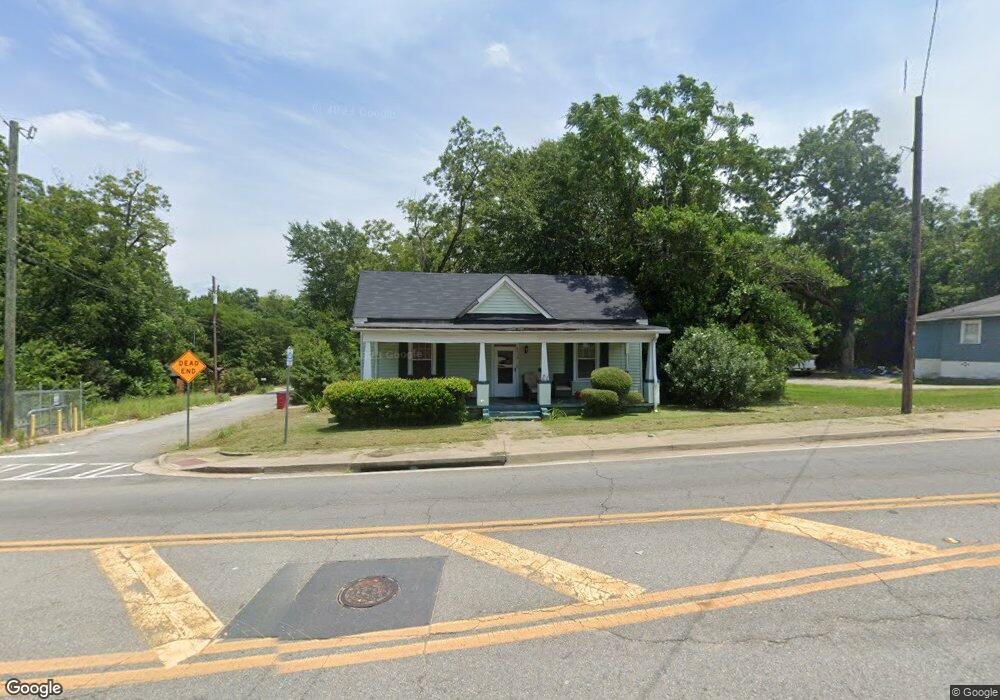
2510 Houston Ave Macon, GA 31206
Tindall Heights Historic District NeighborhoodEstimated Value: $53,000 - $103,000
3
Beds
1
Bath
1,710
Sq Ft
$43/Sq Ft
Est. Value
About This Home
This home is located at 2510 Houston Ave, Macon, GA 31206 and is currently estimated at $73,465, approximately $42 per square foot. 2510 Houston Ave is a home located in Bibb County with nearby schools including Ingram-Pye Elementary School, Central High School, and Cirrus Charter Academy.
Ownership History
Date
Name
Owned For
Owner Type
Purchase Details
Closed on
Oct 7, 2022
Sold by
Balkcom Lillie Ruth
Bought by
Down South Strategies Llc
Current Estimated Value
Home Financials for this Owner
Home Financials are based on the most recent Mortgage that was taken out on this home.
Original Mortgage
$65,500
Interest Rate
5.66%
Mortgage Type
Construction
Purchase Details
Closed on
Feb 25, 2005
Sold by
Kendrick Lillie Ruth
Bought by
Balkcom Lillie
Create a Home Valuation Report for This Property
The Home Valuation Report is an in-depth analysis detailing your home's value as well as a comparison with similar homes in the area
Home Values in the Area
Average Home Value in this Area
Purchase History
| Date | Buyer | Sale Price | Title Company |
|---|---|---|---|
| Down South Strategies Llc | $39,500 | None Listed On Document | |
| Balkcom Lillie | -- | None Available |
Source: Public Records
Mortgage History
| Date | Status | Borrower | Loan Amount |
|---|---|---|---|
| Closed | Down South Strategies Llc | $65,500 |
Source: Public Records
Tax History Compared to Growth
Tax History
| Year | Tax Paid | Tax Assessment Tax Assessment Total Assessment is a certain percentage of the fair market value that is determined by local assessors to be the total taxable value of land and additions on the property. | Land | Improvement |
|---|---|---|---|---|
| 2025 | $858 | $34,904 | $2,600 | $32,304 |
| 2024 | $886 | $34,904 | $2,600 | $32,304 |
| 2023 | $779 | $30,691 | $2,600 | $28,091 |
| 2022 | $400 | $18,542 | $2,520 | $16,022 |
| 2021 | $439 | $18,542 | $2,520 | $16,022 |
| 2020 | $448 | $18,542 | $2,520 | $16,022 |
| 2019 | $726 | $18,542 | $2,520 | $16,022 |
| 2018 | $458 | $18,542 | $2,520 | $16,022 |
| 2017 | $164 | $18,542 | $2,520 | $16,022 |
| 2016 | $141 | $18,542 | $2,520 | $16,022 |
| 2015 | $207 | $18,542 | $2,520 | $16,022 |
| 2014 | $328 | $18,542 | $2,520 | $16,022 |
Source: Public Records
Map
Nearby Homes
- 2494 Houston Ave
- 2524 Houston Ave
- 559 Oliver St
- 2476 Houston Ave
- 2495 Houston Ave
- 2460 Houston Ave
- 557 Daley St
- 568 Daley St
- 2407 Ibex Ln
- 2415 Ibex Ln
- 488 Ibex St
- 498 Ibex St Unit 496
- 498 Ibex St Unit 498
- 2463 Houston Ave
- 576 Daley St
- 565 Daley St
- 466 Ibex St
- 460 Ibex St
- 2444 Houston Ave
- 573 Daley St