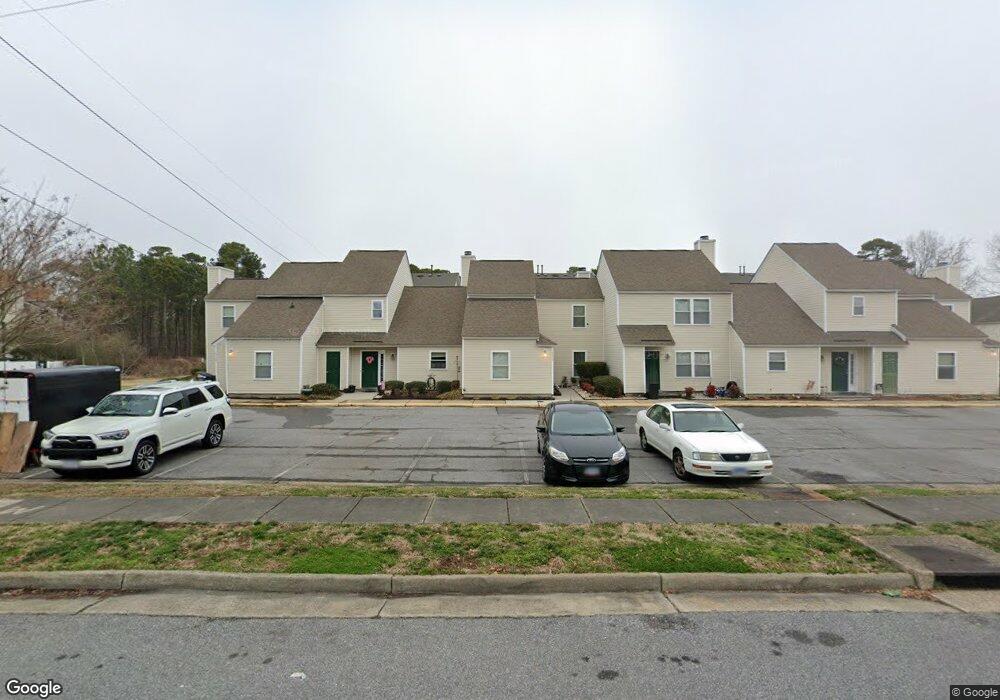
2510 New London Ct Virginia Beach, VA 23454
Great Neck NeighborhoodEstimated Value: $363,616 - $401,000
4
Beds
3
Baths
2,068
Sq Ft
$184/Sq Ft
Est. Value
About This Home
This home is located at 2510 New London Ct, Virginia Beach, VA 23454 and is currently estimated at $380,654, approximately $184 per square foot. 2510 New London Ct is a home located in Virginia Beach City with nearby schools including King's Grant Elementary School, Great Neck Middle School, and Frank W. Cox High School.
Ownership History
Date
Name
Owned For
Owner Type
Purchase Details
Closed on
Nov 2, 2022
Sold by
Watson Dylan J and Ross Joshua
Bought by
Faughnan Michael and Faughnan Sheila
Current Estimated Value
Purchase Details
Closed on
Mar 31, 2020
Sold by
Watson Dylan J
Bought by
Watson Dylan J and Ross Joshua
Home Financials for this Owner
Home Financials are based on the most recent Mortgage that was taken out on this home.
Original Mortgage
$270,072
Interest Rate
3.4%
Mortgage Type
VA
Purchase Details
Closed on
Mar 18, 2020
Sold by
Singh Gagandeep
Bought by
Watson Dylan J
Home Financials for this Owner
Home Financials are based on the most recent Mortgage that was taken out on this home.
Original Mortgage
$270,072
Interest Rate
3.4%
Mortgage Type
VA
Purchase Details
Closed on
Aug 13, 2010
Sold by
Ocean Developmnt Inc
Bought by
Singh Gagandeep
Home Financials for this Owner
Home Financials are based on the most recent Mortgage that was taken out on this home.
Original Mortgage
$207,900
Interest Rate
4.63%
Mortgage Type
New Conventional
Create a Home Valuation Report for This Property
The Home Valuation Report is an in-depth analysis detailing your home's value as well as a comparison with similar homes in the area
Home Values in the Area
Average Home Value in this Area
Purchase History
| Date | Buyer | Sale Price | Title Company |
|---|---|---|---|
| Faughnan Michael | $314,000 | Stewart Title | |
| Watson Dylan J | -- | Bay Area Title And Assc Inc | |
| Watson Dylan J | $264,000 | Bay Area Title & Assc Inc | |
| Singh Gagandeep | $259,900 | -- |
Source: Public Records
Mortgage History
| Date | Status | Borrower | Loan Amount |
|---|---|---|---|
| Previous Owner | Watson Dylan J | $270,072 | |
| Previous Owner | Singh Gagandeep | $207,900 |
Source: Public Records
Tax History Compared to Growth
Tax History
| Year | Tax Paid | Tax Assessment Tax Assessment Total Assessment is a certain percentage of the fair market value that is determined by local assessors to be the total taxable value of land and additions on the property. | Land | Improvement |
|---|---|---|---|---|
| 2025 | $2,954 | $333,800 | $85,000 | $248,800 |
| 2024 | $2,954 | $304,500 | $75,000 | $229,500 |
| 2023 | $2,892 | $292,100 | $75,000 | $217,100 |
| 2022 | $2,784 | $281,200 | $70,000 | $211,200 |
| 2021 | $2,658 | $268,500 | $70,000 | $198,500 |
| 2020 | $2,637 | $259,200 | $65,000 | $194,200 |
| 2019 | $2,729 | $253,500 | $60,000 | $193,500 |
| 2018 | $2,541 | $253,500 | $60,000 | $193,500 |
| 2017 | $2,541 | $253,500 | $60,000 | $193,500 |
| 2016 | $2,452 | $247,700 | $60,000 | $187,700 |
| 2015 | $2,452 | $247,700 | $60,000 | $187,700 |
| 2014 | $2,251 | $242,000 | $64,800 | $177,200 |
Source: Public Records
Map
Nearby Homes
- 400 Egret Landing Unit 202
- 412 Egret Landing Unit 303
- 2557 Oconee Ave Unit 202
- 393 River Forest Rd
- 2401 London Pointe Dr
- 2425 London Pointe Dr
- 405 Hidden Shores Ct Unit 104
- 2385 London Pointe Dr
- 2524 Hidden Shores Dr Unit 104
- 2421 Julie Ct
- 2404 Julie Ct
- 520 Lake Havasu Dr
- 2309 London Pointe Dr
- 2505 Reagan Ave
- 410 Big Leaf Cir
- 2304 Flanders Ct
- 449 Old Great Neck Rd
- 2529 Peritan Rd
- 299 Windship Cove
- 516 W Farmington Rd
- 2508 New London Ct
- 2508 New London Ct Unit 2508
- 2512 New London Ct
- 2512 New London Ct Unit 2512
- 2504 New London Ct
- 2504 New London Ct Unit 2504
- 400 New London Place
- 2502 New London Ct
- 2500 New London Ct
- 2511 New London Ct
- 2509 New London Ct
- 2507 New London Ct
- 2513 New London Ct
- 2505 New London Ct
- 2503 New London Ct
- 2501 New London Ct
- 418 New London Place
- 420 New London Place
- 416 New London Place
- 424 New London Place